Visualized: Interest Rate Forecasts for Advanced Economies
The Best U.S. Companies to Work for According to LinkedIn
The Top Private Equity Firms by Country
Economic Growth Forecasts for G7 and BRICS Countries in 2024
U.S. Debt Interest Payments Reach $1 Trillion
All of the Grants Given by the U.S. CHIPS Act
Visualizing AI Patents by Country
How Tech Logos Have Evolved Over Time
Ranked: Semiconductor Companies by Industry Revenue Share
The Stock Performance of U.S. Chipmakers So Far in 2024
Ranked: The Top 20 Countries in Debt to China
Charted: Which Country Has the Most Billionaires in 2024?
Charted: Which City Has the Most Billionaires in 2024?
Charted: Who Has Savings in This Economy?
How Debt-to-GDP Ratios Have Changed Since 2000
The Cost of an EpiPen in Major Markets
Charted: Global Tobacco Use by Country and Sex
Visualized: What Lives in Your Gut Microbiome?
Charted: Average Years Left to Live by Age
Charted: The Average Cost of Insulin By Country
Mapped: The Age of Energy Projects in Interconnection Queues, by State
Ranked: The Top 10 EV Battery Manufacturers in 2023
The World’s Biggest Nuclear Energy Producers
The World’s Biggest Oil Producers in 2023
How Much Does the U.S. Depend on Russian Uranium?
The Largest Earthquakes in the New York Area (1970-2024)
Mapped: Average Wages Across Europe
Mapped: Asia’s Population Patterns by Density
A Map of Global Happiness By Country in 2024
Mapped: Population Growth by Region (1900-2050F)
Visualizing Global Gold Production in 2023
Gold vs. S&P 500: Which Has Grown More Over Five Years?
Charted: The Value Gap Between the Gold Price and Gold Miners
Charted: Global Uranium Reserves, by Country
The Carbon Footprint of Major Travel Methods
Ranking the Top 15 Countries by Carbon Tax Revenue
Ranked: The Countries With the Most Air Pollution in 2023
Top Countries By Forest Growth Since 2001
Ranked: Top Countries by Total Forest Loss Since 2001
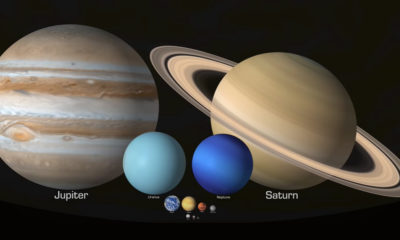
...in many ways, yet work in perfect unison. A comparative study of the various features of these celestial bodies gives us some fascinating results. The above...
Animation: New Water Map of Mars The hunt for water on Mars has always been a point of interest for researchers. Earth has life almost everywhere...
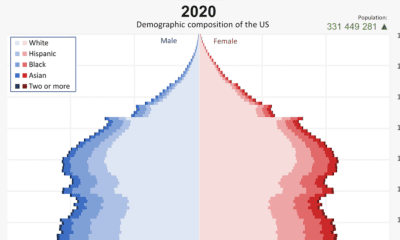
...most obvious takeaway from this animation is that America’s population has soared over the last century. America’s population grew from 77 million in 1901 to over...
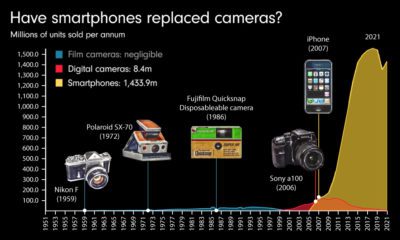
...camera sales have plummeted. This animation by James Eagle compares annual sales data for film cameras, digital cameras, and smartphones over the years to show just...
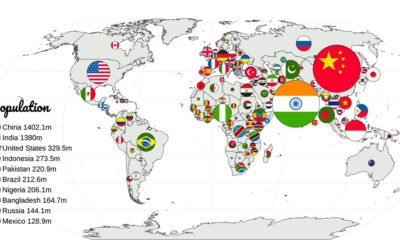
...Domestic Product (GDP), military expenditures, or tech exports? Instead of comparing countries by one metric, this animation and series of graphics by Anders Sundell uses 20...
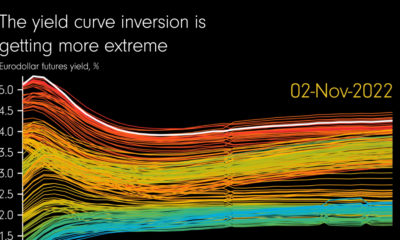
...world feel about interest rates—and economic strength. How The Yield Curve’s Inversion Has Gotten More Extreme The animation above clearly shows how the yield curve hasn’t...
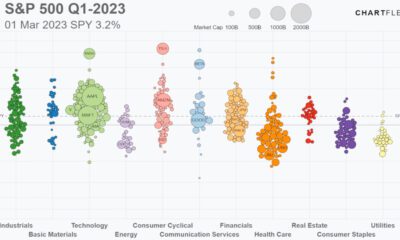
...rebound. The above animation from Jan Varsava shows the stock performance of each company on the S&P 500, categorized by sector. Biggest Gainers on the S&P...
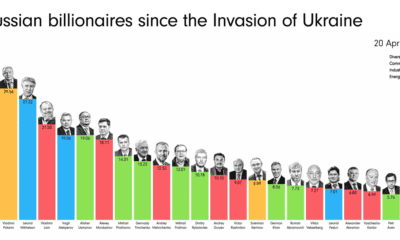
...vocal and fiscal support in exchange for sweetheart deals or beneficial government oversight. This animation from James Eagle shows how the estimated net wealth of the...
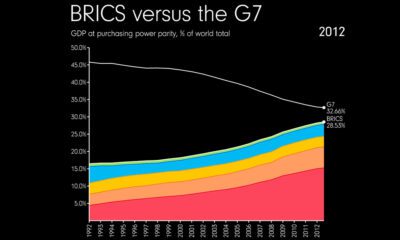
...its own section of the global economic order. This animation from James Eagle uses data from the International Monetary Fund (IMF) and charts the percentage contribution...
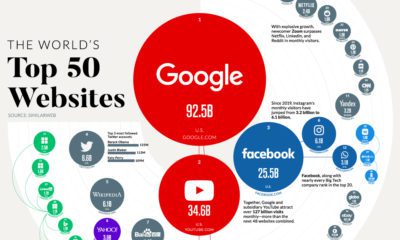
...Walmart.com 718.6M U.S. Marketplace 42 Bilibili.com 686.0M China Animation and Comics 43 Tiktok.com 663.2M China Social Networks and Online Communities 44 Paypal.com 657.2M U.S. Financial Planning...


 Creator Program