Space
Comparing Objects in Our Solar System by Rotation, Size, and More
Article/Editing:
Comparison of Selected Objects in our Solar System
Our solar system is home to various celestial objects, including planets, moons, asteroids, and even dwarf planets.
All of these objects differ in many ways, yet work in perfect unison. A comparative study of the various features of these celestial bodies gives us some fascinating results.
The above animation from planetary scientist Dr. James O’Donoghue helps put in perspective the different objects in the solar system in terms of size, rotational speed, and the axial tilt at which they rotate.
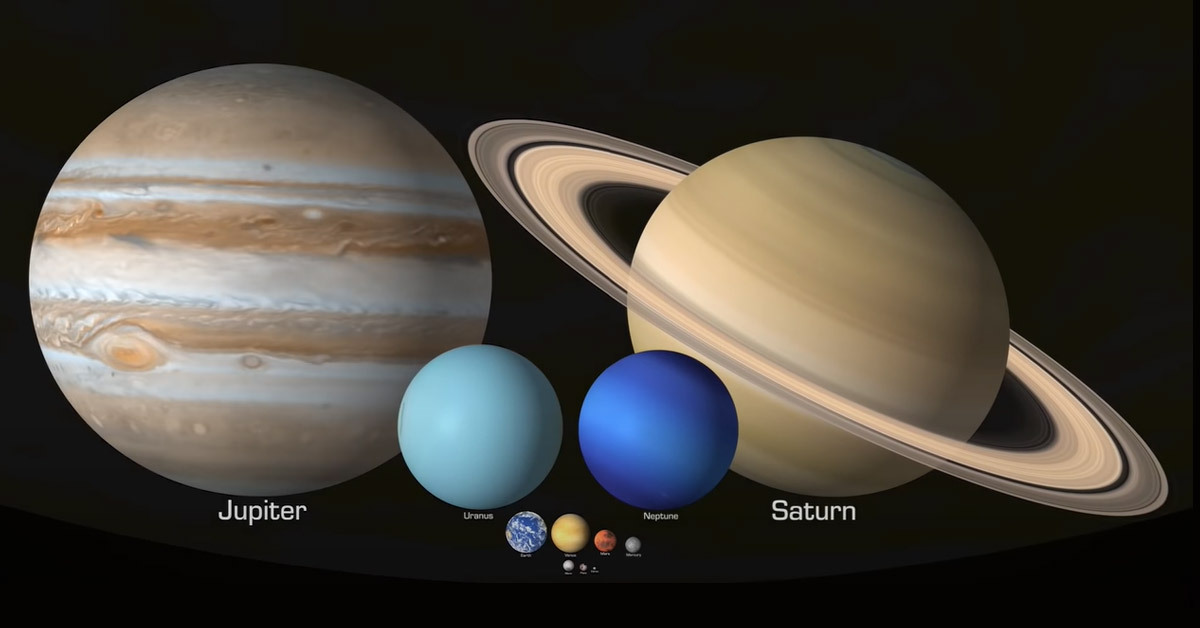
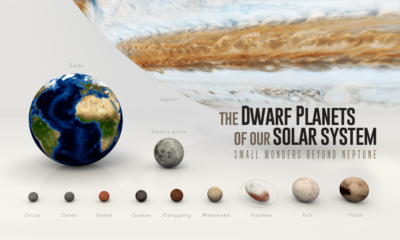
Selected Solar System Objects to Scale
With such a diverse solar system of planets and other celestial objects, there is no shortage of questions to think about. Like what is the exact diameter of Jupiter, or how fast does Pluto rotate?
To answer them, here is a comparison of some select celestial bodies in our solar system, going from the biggest to smallest objects:
| Celestial Body | Diameter (km) | Rotational Period (Hours) | Axial Tilt |
|---|---|---|---|
| Sun | 1.4M | 648 | 7.2° |
| Jupiter | 140,982 | 9.9 | 3.1° |
| Saturn | 120,536 | 10.7 | 26.7° |
| Uranus | 51,118 | -17.2 | 97.8° |
| Neptune | 49,528 | 16.1 | 28.3° |
| Earth | 12,756 | 23.9 | 23.5° |
| Venus | 12,104 | -5832 | 177.4° |
| Mars | 6,792 | 24.6 | 25.2° |
| Mercury | 4,879 | 1407.6 | 0.03° |
| Moon | 3,475 | 655.7 | 6.7° |
| Pluto | 2,376 | -153.3 | 122.5° |
| Ceres | 946 | 9 | 4° |
Planets like Venus or Pluto rotate in the opposite direction to Earth, or in retrograde, and thus are denoted with a negative symbol before their values.
Another interesting observation is that the Sun rotates on its axis only once in about 27 days and has an axial tilt of about 7.25 degrees from the axis of Earth’s orbit. Hence, we see more of the Sun’s north pole in September of each year and the south pole in March.
How do the Various Objects Compare Against Earth?
The Earth we live on is a unique planet within our solar system containing water and air, and is where living things thrive. But, aside from those surface level differences, is our home really different from other planets and celestial objects?
In the table below, we compare other nearby celestial bodies with Earth, using ratios—this time, from smallest to largest:
| Celestial Body | Diameter (ratio to Earth) | Rotational Period (ratio to Earth) |
|---|---|---|
| Ceres | 0.07 | 0.37 |
| Pluto | 0.18 | 6.41 |
| Moon | 0.27 | 27.4 |
| Mercury | 0.38 | 58.8 |
| Mars | 0.53 | 1.03 |
| Venus | 0.94 | -244 |
| Earth | 1 | 1 |
| Neptune | 3.88 | 0.67 |
| Uranus | 4.01 | -0.72 |
| Saturn | 9.45 | 0.44 |
| Jupiter | 11.31 | 0.41 |
| Sun | 109 | 27 |
Though Jupiter is around 11 times wider than Earth, its rotational period is only 0.4 times as long as our planet’s—meaning it rotates at a much faster speed.
On the other hand, Venus uses a slow and steady approach, taking 244 times longer to make one rotation (in comparison to background stars) when contrasted to Earth.

This article was published as a part of Visual Capitalist's Creator Program, which features data-driven visuals from some of our favorite Creators around the world.


Space
Which Companies Own the Most Satellites?
Despite Starlink’s dominance in the industry, the company is set to face intense competition in the coming years.
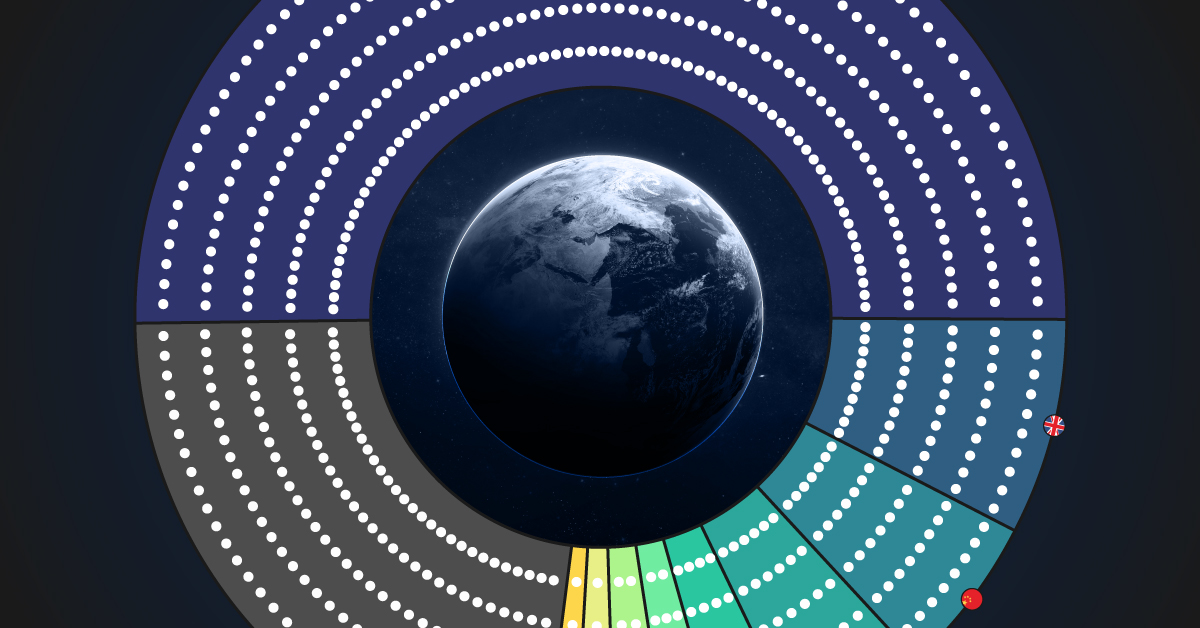
Which Companies Own the Most Satellites?
Nearly 7,000 satellites orbit the Earth, serving vital functions such as communication, navigation, and scientific research.
In 2022 alone, more than 150 launches took place, sending new instruments into space, with many more expected over the next decade.
But who owns these objects? In this graphic, we utilize data from the Union of Concerned Scientists to highlight the leaders in satellite technology.
SpaceX’s Dominance in Space
SpaceX, led by Elon Musk, is unquestionably the industry leader, currently operating the largest fleet of satellites in orbit—about 50% of the global total.
The company has already completed 62 missions this year, surpassing any other company or nation, and operates thousands of internet-beaming Starlink spacecraft that provide global internet connectivity.
Starlink customers receive a small satellite dish that self-orients itself to align with Starlink’s low-Earth-orbit satellites.
| Owner | Total | Share | Country |
|---|---|---|---|
| SpaceX | 3,395 | 50% | USA |
| OneWeb Satellites | 502 | 7% | UK |
| Chinese Government | 369 | 5% | China |
| U.S. Government | 306 | 4% | USA |
| Planet Labs, Inc. | 195 | 3% | USA |
| Russian Federation | 137 | 2% | Russia |
| Spire Global Inc. | 127 | 2% | USA |
| Swarm Technologies | 84 | 1% | USA |
| Iridium Communications, Inc. | 75 | 1% | USA |
| Other | 1,528 | 23% |
Percentages may not add to 100 due to rounding.
In second place is a lesser-known company, British OneWeb Satellites. The company, headquartered in London, counts the UK government among its investors and provides high-speed internet services to governments, businesses, and communities.
Like many other satellite operators, OneWeb relies on SpaceX to launch its satellites.
Despite Starlink’s dominance in the industry, the company is set to face intense competition in the coming years. Amazon’s Project Kuiper plans to deploy 3,236 satellites by 2029 to compete with SpaceX’s network. The first of the fleet could launch as early as 2024.
The Rise of China’s Space Program
After the top private companies, governments also own a significant portion of satellites orbiting the Earth. The U.S. remains the leader in total satellites, when adding those owned by both companies and government agencies together.
American expenditures on space programs reached $62 billion in 2022, five times more than the second one, China.
China, however, has sped up its space program over the last 20 years and currently has the highest number of satellites in orbit belonging directly to government agencies. Most of these are used for Earth observation, communications, defense, and technology development.
Satellite Demand to Rise Over the Decade
Despite the internet being taken for granted in major metropolitan areas and developed countries, one out of every three people worldwide has never used the web.
Furthermore, the increasing demand for data and the emergence of new, more cost-effective satellite technologies are expected to present significant opportunities for private space companies.
In this context, satellite demand is projected to quadruple over the next decade.

-

 Debt1 week ago
How Debt-to-GDP Ratios Have Changed Since 2000
-

 Markets2 weeks ago
Ranked: The World’s Top Flight Routes, by Revenue
-

 Countries2 weeks ago
Population Projections: The World’s 6 Largest Countries in 2075
-

 Markets2 weeks ago
The Top 10 States by Real GDP Growth in 2023
-

 Demographics2 weeks ago
The Smallest Gender Wage Gaps in OECD Countries
-

 United States2 weeks ago
Where U.S. Inflation Hit the Hardest in March 2024
-

 Green2 weeks ago
Top Countries By Forest Growth Since 2001
-

 United States2 weeks ago
Ranked: The Largest U.S. Corporations by Number of Employees