Technology
Animated Chart: The Smartphone Effect on the Camera Market
Article/Editing:
Charting the Smartphone Effect on the Camera Market
The smartphone camera has come a long way since the early 2000s, and its impact on the overall camera market cannot be understated.
In fact, modern smartphones have become so sophisticated that the CEO of Sony’s semiconductor manufacturing company predicts that smartphone cameras will soon produce better quality images than DSLR cameras.
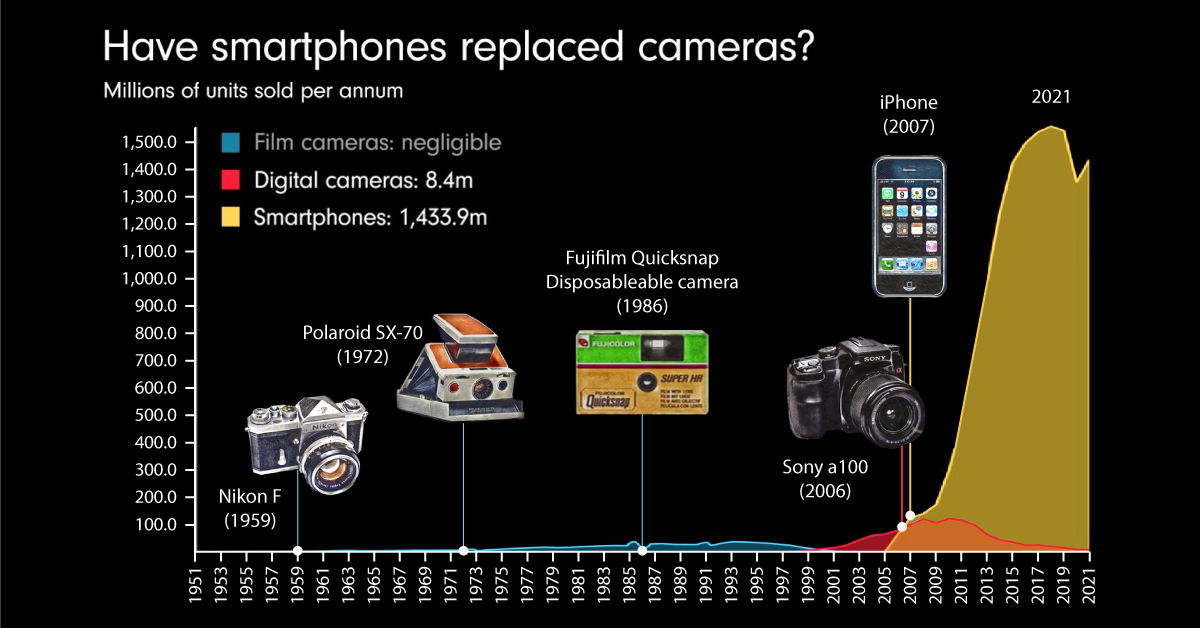
Whether smartphones will be able to completely replace standalone cameras is still a contentious debate topic, but one thing is clear—while smartphone sales have skyrocketed over the last decade, digital camera sales have plummeted.
This animation by James Eagle compares annual sales data for film cameras, digital cameras, and smartphones over the years to show just how much smartphones have impacted the camera market.
A (Brief) History of Standalone Cameras
Below, we’ve broken down the history of cameras into three overarching periods: early cameras, film cameras, and digital cameras.
Early Cameras
Cameras have been around for thousands of years, with descriptions of camera-like devices found in historical writings dating back as far as the 4th century:
- 330 AD: Ancient Chinese texts describe a device known as a camera obscura. Similar to pinhole cameras, these didn’t produce actual photographs, but rather reflected light onto screens which could then be traced to produce a lasting image.
- Early 1800s: It’s generally accepted that Joseph Nicéphore Niépce invented the first photographic camera in 1816. Using silver chloride, Niépce managed to develop an image that’s still around today.
- 1840s: Early cameras produced negative images which had to be color corrected, until mirrored cameras were invented. Alexander S. Wolcott was the first person to patent a mirrored camera in 1840.
- 1871: Richard Leach Maddox came up with an invention that led to instantaneous exposure, meaning cameras only needed to be exposed to light for a few seconds before producing an image.
These early inventions were critical milestones in the development of the modern-day camera. However, cameras and film weren’t available to the masses until Kodak’s Brownie camera made photography relatively cheap.
The Emergence of Film Cameras
Released in 1900, the Kodak Brownie was a handheld, inexpensive roll film camera invented by George Eastman.
When it first launched, the camera sold for $1.00, equivalent to about $35.48 in 2022 dollars. With more than 100,000 cameras sold within the first year, Eastman is often credited for making photography accessible to the masses.
Fast forward a few decades, and technological advancements led to features in cameras like viewfinders, different shutter speeds, and detachable lenses. These features were possible on what’s known as twin lens reflex cameras, or TLR for short, but they were soon replaced by single lens reflex cameras (SLR).
Digital Cameras Enter the Scene
By the late 1990s, digital cameras were invented and began quickly outselling film cameras.
Unlike their film counterparts, digital cameras feature a digital sensor, and store images on a memory card which could store thousands of pictures.
Digital camera sales grew throughout the early 2000s—in 2005 the Photo Marketing Association International even estimated that 52% of households would own a digital camera by the end of the year.
The Smartphone Camera Changes the Game
In the early 2000s, camera phones were far less powerful than their standalone counterparts.
For instance, one of the first camera phones to hit the market, Samsung’s SCH-V200, could take 20 pictures at 0.35-megapixel resolution. In contrast, Canon’s EOS D30 digital camera released the same year had a resolution of 3 megapixels.
But the advent of the iPhone, and the rollout and accessibility of modern smartphones with powerful cameras, quickly saw many non-enthusiasts switch to smartphone cameras only. In 2022, Google’s Pixel 7 has multiple built-in cameras, with both a 50 megapixel wide rear camera and a 12 megapixel ultrawide rear camera. In comparison, Canon’s enthusiast EOS 850 has a 24.1 megapixel sensor.
The animated chart above highlights the direct impact on the digital camera market after its 2009/2010 peak:
| Year | Digital Camera Sales |
|---|---|
| 1999 | 10.2 million |
| 2009 | 121.2 million |
| 2021 | 8.4 million |
So does that make a modern smartphone camera better? Not at all, as there are other a multitude of factors to consider when assessing a camera’s quality besides resolution. But in an article in Wired Magazine, tech journalist Sam Kieldsen explains how the market has shifted:
[Smartphones have] effectively killed off the cheap pocket point-and-shoot camera already, but there’s still so much they can’t do in comparison to a true purpose-built mirrorless or DSLR camera. Low light image quality, convincing bokeh effects and extreme close-up macro photography are all still significantly better on a real camera.
Smartphones may not be fully replacing DSLR cameras anytime soon, but they’ve certainly changed the industry and game in which it plays.

This article was published as a part of Visual Capitalist's Creator Program, which features data-driven visuals from some of our favorite Creators around the world.


Technology
Ranked: Semiconductor Companies by Industry Revenue Share
Nvidia is coming for Intel’s crown. Samsung is losing ground. AI is transforming the space. We break down revenue for semiconductor companies.


Semiconductor Companies by Industry Revenue Share
This was originally posted on our Voronoi app. Download the app for free on Apple or Android and discover incredible data-driven charts from a variety of trusted sources.
Did you know that some computer chips are now retailing for the price of a new BMW?
As computers invade nearly every sphere of life, so too have the chips that power them, raising the revenues of the businesses dedicated to designing them.
But how did various chipmakers measure against each other last year?
We rank the biggest semiconductor companies by their percentage share of the industry’s revenues in 2023, using data from Omdia research.
Which Chip Company Made the Most Money in 2023?
Market leader and industry-defining veteran Intel still holds the crown for the most revenue in the sector, crossing $50 billion in 2023, or 10% of the broader industry’s topline.
All is not well at Intel, however, with the company’s stock price down over 20% year-to-date after it revealed billion-dollar losses in its foundry business.
| Rank | Company | 2023 Revenue | % of Industry Revenue |
|---|---|---|---|
| 1 | Intel | $51B | 9.4% |
| 2 | NVIDIA | $49B | 9.0% |
| 3 | Samsung Electronics | $44B | 8.1% |
| 4 | Qualcomm | $31B | 5.7% |
| 5 | Broadcom | $28B | 5.2% |
| 6 | SK Hynix | $24B | 4.4% |
| 7 | AMD | $22B | 4.1% |
| 8 | Apple | $19B | 3.4% |
| 9 | Infineon Tech | $17B | 3.2% |
| 10 | STMicroelectronics | $17B | 3.2% |
| 11 | Texas Instruments | $17B | 3.1% |
| 12 | Micron Technology | $16B | 2.9% |
| 13 | MediaTek | $14B | 2.6% |
| 14 | NXP | $13B | 2.4% |
| 15 | Analog Devices | $12B | 2.2% |
| 16 | Renesas Electronics Corporation | $11B | 1.9% |
| 17 | Sony Semiconductor Solutions Corporation | $10B | 1.9% |
| 18 | Microchip Technology | $8B | 1.5% |
| 19 | Onsemi | $8B | 1.4% |
| 20 | KIOXIA Corporation | $7B | 1.3% |
| N/A | Others | $126B | 23.2% |
| N/A | Total | $545B | 100% |
Note: Figures are rounded. Totals and percentages may not sum to 100.
Meanwhile, Nvidia is very close to overtaking Intel, after declaring $49 billion of topline revenue for 2023. This is more than double its 2022 revenue ($21 billion), increasing its share of industry revenues to 9%.
Nvidia’s meteoric rise has gotten a huge thumbs-up from investors. It became a trillion dollar stock last year, and broke the single-day gain record for market capitalization this year.
Other chipmakers haven’t been as successful. Out of the top 20 semiconductor companies by revenue, 12 did not match their 2022 revenues, including big names like Intel, Samsung, and AMD.
The Many Different Types of Chipmakers
All of these companies may belong to the same industry, but they don’t focus on the same niche.
According to Investopedia, there are four major types of chips, depending on their functionality: microprocessors, memory chips, standard chips, and complex systems on a chip.
Nvidia’s core business was once GPUs for computers (graphics processing units), but in recent years this has drastically shifted towards microprocessors for analytics and AI.
These specialized chips seem to be where the majority of growth is occurring within the sector. For example, companies that are largely in the memory segment—Samsung, SK Hynix, and Micron Technology—saw peak revenues in the mid-2010s.

-

 Real Estate2 weeks ago
Visualizing America’s Shortage of Affordable Homes
-

 Technology1 week ago
Ranked: Semiconductor Companies by Industry Revenue Share
-

 Money1 week ago
Which States Have the Highest Minimum Wage in America?
-

 Real Estate1 week ago
Ranked: The Most Valuable Housing Markets in America
-

 Business2 weeks ago
Charted: Big Four Market Share by S&P 500 Audits
-

 AI2 weeks ago
The Stock Performance of U.S. Chipmakers So Far in 2024
-

 Misc2 weeks ago
Almost Every EV Stock is Down After Q1 2024
-

 Money2 weeks ago
Where Does One U.S. Tax Dollar Go?