U.S. Debt Interest Payments Reach $1 Trillion
Ranked: The Largest U.S. Corporations by Number of Employees
The Top 10 States by Real GDP Growth in 2023
Ranked: The World’s Top Flight Routes, by Revenue
Ranked: The Most Valuable Housing Markets in America
Ranked: Semiconductor Companies by Industry Revenue Share
The Stock Performance of U.S. Chipmakers So Far in 2024
Ranked: The Most Popular Smartphone Brands in the U.S.
Visualizing Nvidia’s Revenue, by Product Line (2019-2024)
Visualizing Internet Usage by Global Region
How Debt-to-GDP Ratios Have Changed Since 2000
The Smallest Gender Wage Gaps in OECD Countries
Which States Have the Highest Minimum Wage in America?
Where Does One U.S. Tax Dollar Go?
Visualizing the Growth of $100, by Asset Class (1970-2023)
The Cost of an EpiPen in Major Markets
Charted: Global Tobacco Use by Country and Sex
Visualized: What Lives in Your Gut Microbiome?
Charted: Average Years Left to Live by Age
Charted: The Average Cost of Insulin By Country
The World’s Biggest Nuclear Energy Producers
The World’s Biggest Oil Producers in 2023
How Much Does the U.S. Depend on Russian Uranium?
Charted: Global Uranium Reserves, by Country
Visualizing the Rise of the U.S. as Top Crude Oil Producer
The Largest Earthquakes in the New York Area (1970-2024)
Mapped: Average Wages Across Europe
Mapped: Asia’s Population Patterns by Density
A Map of Global Happiness By Country in 2024
Mapped: Population Growth by Region (1900-2050F)
Gold vs. S&P 500: Which Has Grown More Over Five Years?
Charted: The Value Gap Between the Gold Price and Gold Miners
The Periodic Table of Commodity Returns (2014-2023)
China Dominates the Supply of U.S. Critical Minerals List
Ranking the Top 15 Countries by Carbon Tax Revenue
Ranked: The Countries With the Most Air Pollution in 2023
Top Countries By Forest Growth Since 2001
Ranked: Top Countries by Total Forest Loss Since 2001
The World’s Top Cocoa Producing Countries
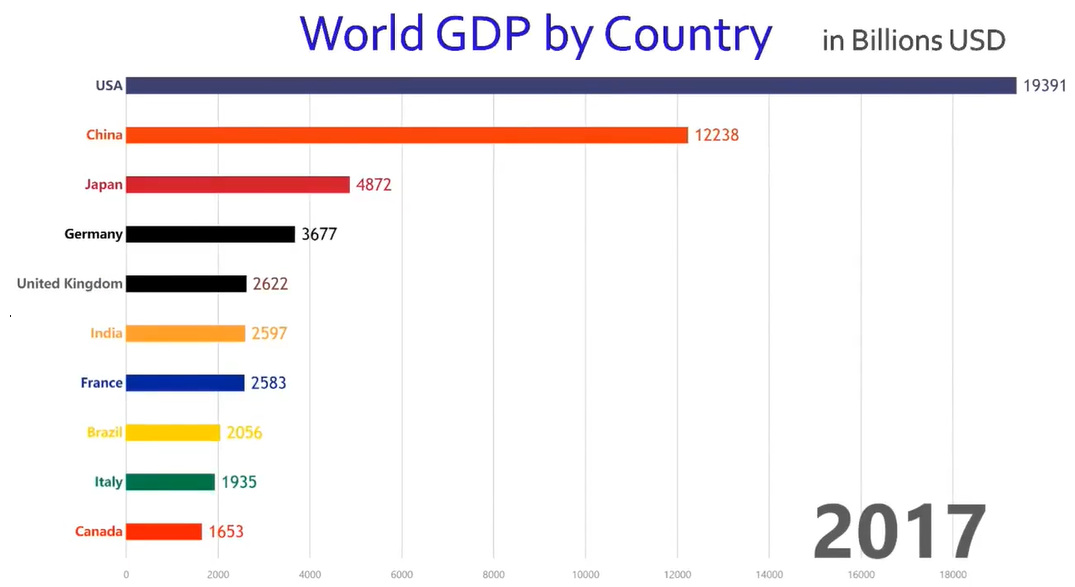
Animation: The World’s 10 Largest Economies by GDP (1960-Today) Just weeks ago, we showed you a colorful visualization that breaks down the $80 trillion global economy....
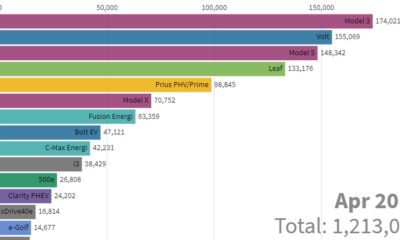
...value of scale, and consumer preferences, all rolled into one nifty animation. Animation currently unavailable The Tesla Roadster starts with a very early lead, but is...
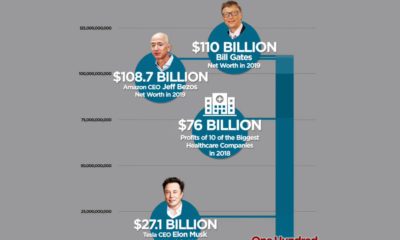
...us, Twitter user @betty__cam put together a short animation that simplifies things. $110 Billion, Visualized The following one minute animation starts with the median household wealth...
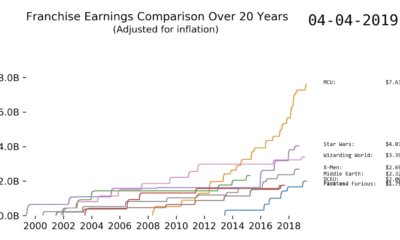
Animation: The Earnings of the Biggest Movie Franchises Over the Last 20 Years From Iron Man to Luke Skywalker, viewers love watching their favorite heroes triumph...
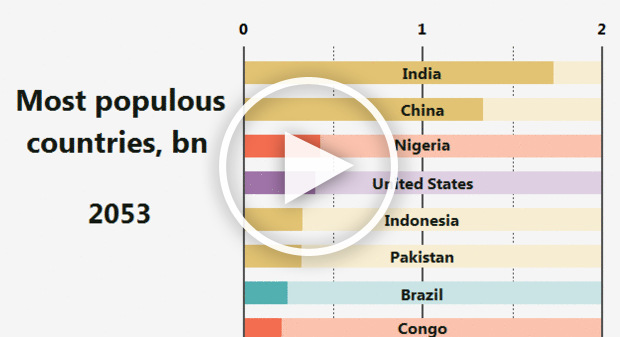
Animation: 100 Years of the Most Populous Countries “I think ageing demographics is a bigger issue in China than people think. And the problems it creates...
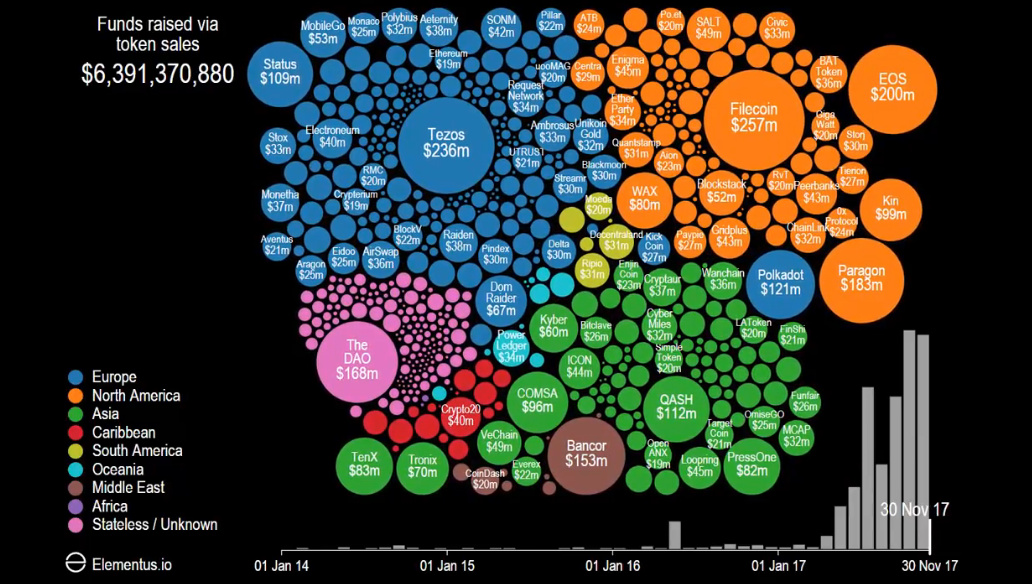
Animation: Visualizing the ICO Explosion In our chart highlighting Bitcoin’s epic journey to $10,000, we also noted that 2017 was a landmark year for the Initial...
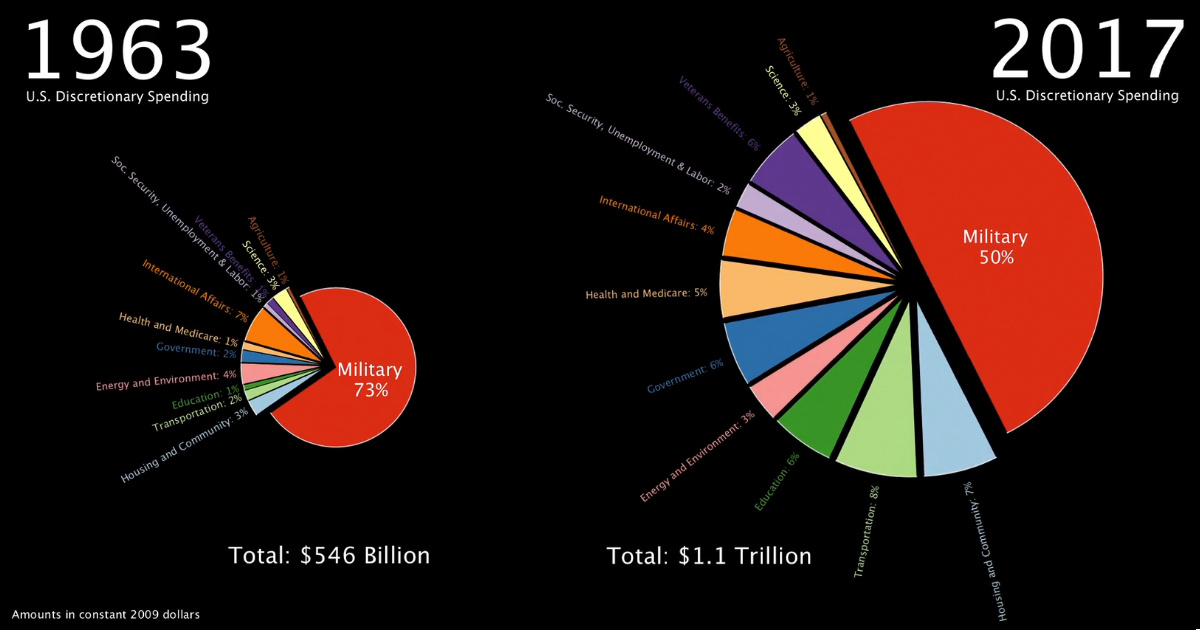
...Time Today’s animation from data scientist Will Geary shows the evolution of U.S. discretionary spending from 1963 until today: The U.S. budget is generally divided into...
...animation was originally posted to Reddit by /r/TheNerdistRedditor and captures the crazy world of tech valuations for public companies. Watch the intense 1 minute animation below:...
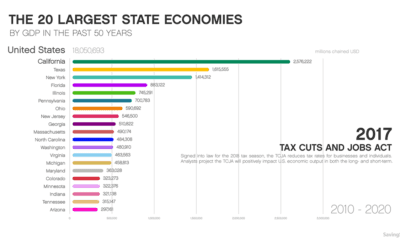
Animation: The 20 Largest State Economies by GDP When it comes to understanding the size and scope of the $18 trillion U.S. economy, it’s sometimes easier...
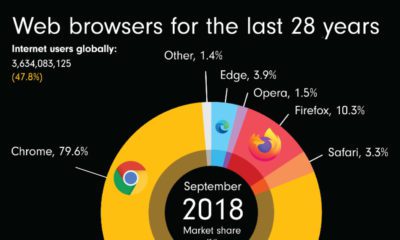
Animation: The Rise and Fall of Popular Web Browsers Since 1994 In its early stages, the internet was a highly technical interface that most people had...


 Creator Program