U.S. Debt Interest Payments Reach $1 Trillion
Ranked: The Largest U.S. Corporations by Number of Employees
The Top 10 States by Real GDP Growth in 2023
Ranked: The World’s Top Flight Routes, by Revenue
Ranked: The Most Valuable Housing Markets in America
How Tech Logos Have Evolved Over Time
Ranked: Semiconductor Companies by Industry Revenue Share
The Stock Performance of U.S. Chipmakers So Far in 2024
Ranked: The Most Popular Smartphone Brands in the U.S.
Visualizing Nvidia’s Revenue, by Product Line (2019-2024)
How Debt-to-GDP Ratios Have Changed Since 2000
The Smallest Gender Wage Gaps in OECD Countries
Which States Have the Highest Minimum Wage in America?
Where Does One U.S. Tax Dollar Go?
Visualizing the Growth of $100, by Asset Class (1970-2023)
The Cost of an EpiPen in Major Markets
Charted: Global Tobacco Use by Country and Sex
Visualized: What Lives in Your Gut Microbiome?
Charted: Average Years Left to Live by Age
Charted: The Average Cost of Insulin By Country
Ranked: The Top 10 EV Battery Manufacturers in 2023
The World’s Biggest Nuclear Energy Producers
The World’s Biggest Oil Producers in 2023
How Much Does the U.S. Depend on Russian Uranium?
Charted: Global Uranium Reserves, by Country
The Largest Earthquakes in the New York Area (1970-2024)
Mapped: Average Wages Across Europe
Mapped: Asia’s Population Patterns by Density
A Map of Global Happiness By Country in 2024
Mapped: Population Growth by Region (1900-2050F)
Gold vs. S&P 500: Which Has Grown More Over Five Years?
Charted: The Value Gap Between the Gold Price and Gold Miners
The Periodic Table of Commodity Returns (2014-2023)
Ranking the Top 15 Countries by Carbon Tax Revenue
Ranked: The Countries With the Most Air Pollution in 2023
Top Countries By Forest Growth Since 2001
Ranked: Top Countries by Total Forest Loss Since 2001
The World’s Top Cocoa Producing Countries
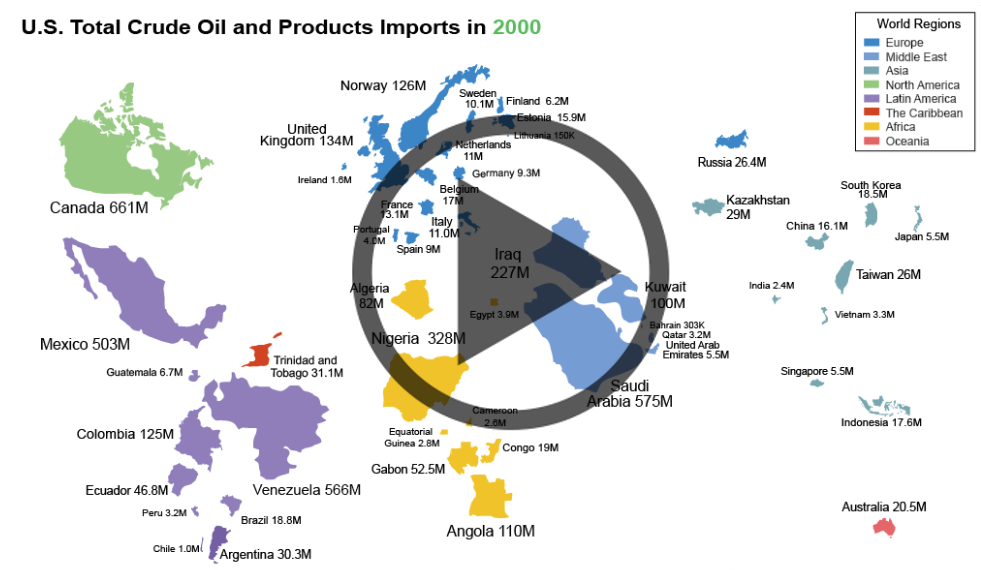
Animation: Oil Imports to the U.S. Have Shifted Dramatically Over 15 Years While green energy is making inroads particularly at the electrical grid, the majority of...
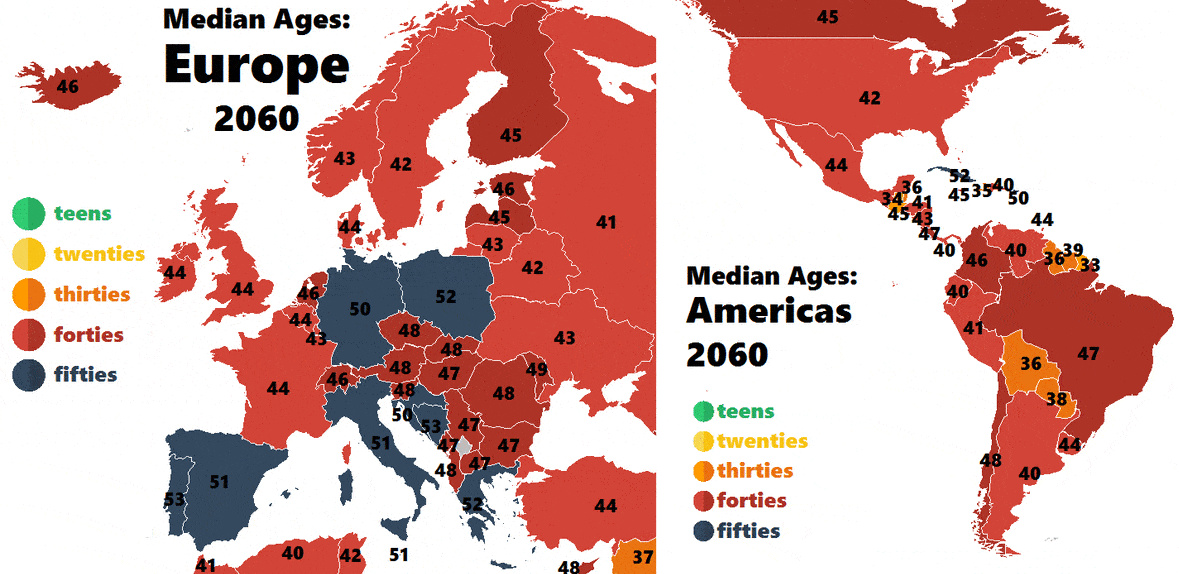
...will be impacted by a rapidly aging population. The above animation from data visualization expert Aron Strandberg shows the median age of European countries between 1960...
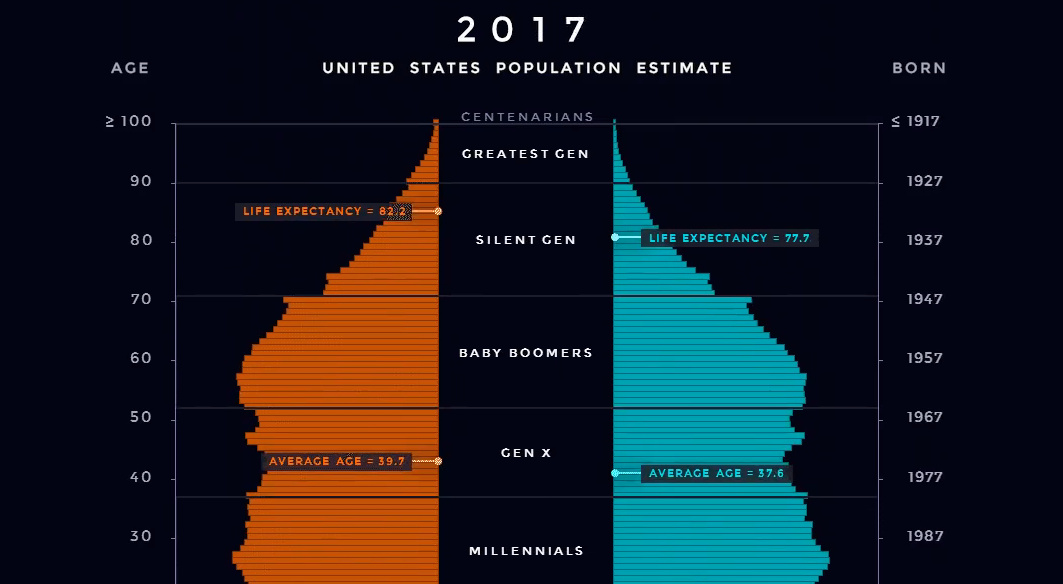
...on the U.S. using a similar type of animation. Below is an animated population pyramid that shows how the U.S. population has been shifting, including projections...
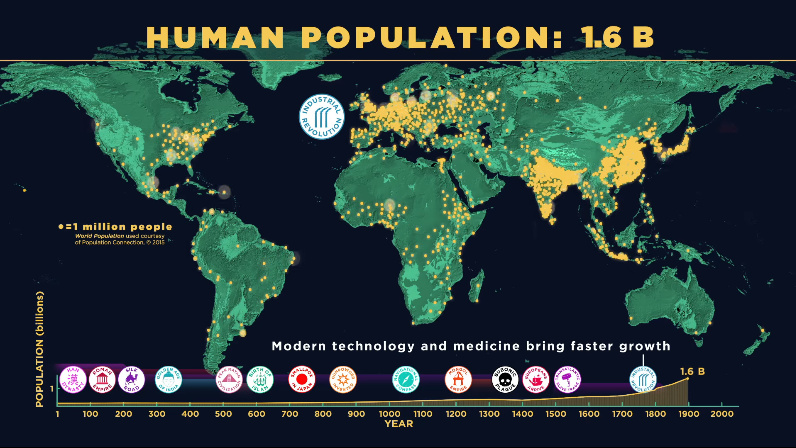
...growth ramp up to get to the billions of people that are alive today? The History of Population Growth Today’s animation comes from the American Museum...
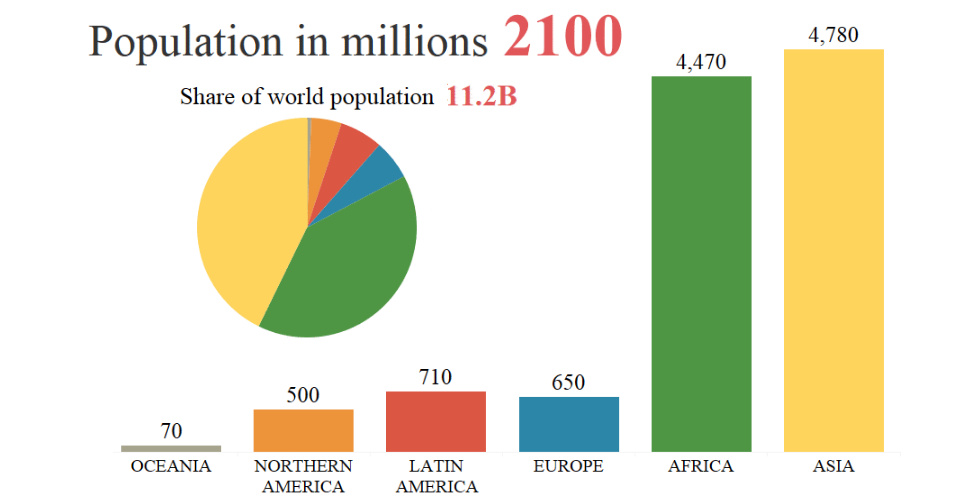
...terms of population? Population by Region (1950-2100) Today’s animation comes to us from geographer Simon Kuestenmacher who used this U.N. data to show how population by...
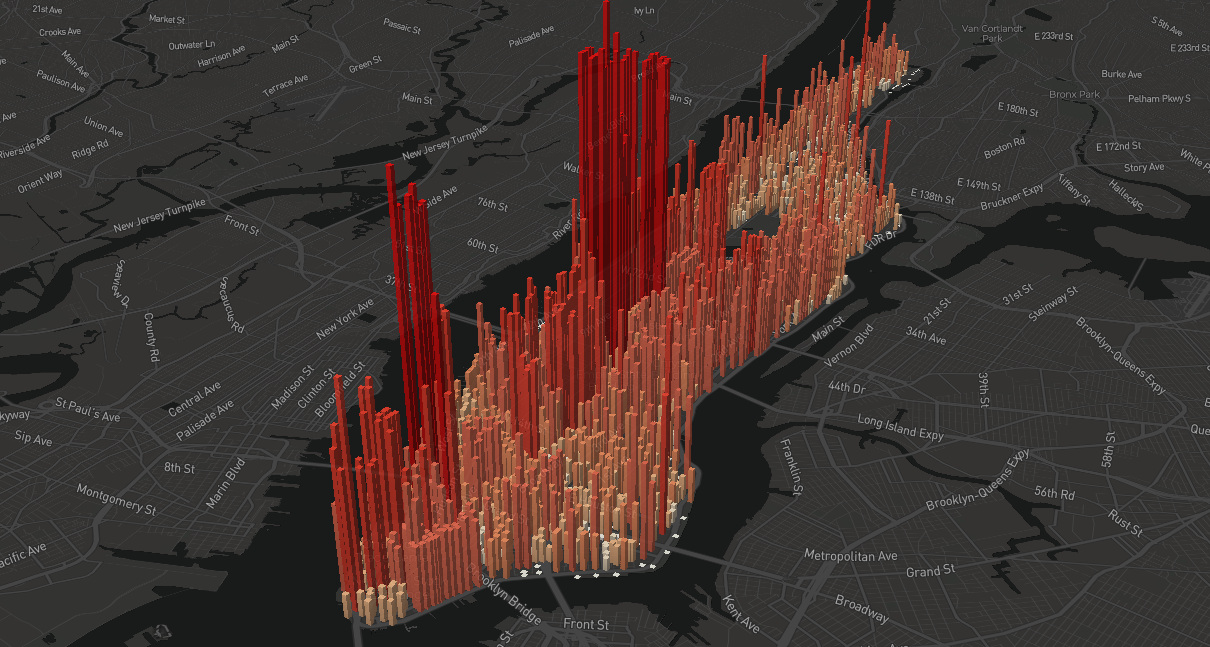
...phenomenon as pronounced as in Manhattan, which swells to an incredible four million people during work hours. Today’s animation, created by Justin Fung, is a dramatic,...
...even though a catastrophic geopolitical or financial event is very unlikely, it is important to be prepared for anything. How Billionaires Protect Their Wealth Today’s animation...
Animation: The World’s Largest Megacities by 2100 Throughout the course of human history, the biggest cities have always seemed impossibly large. For many millennia, it was...
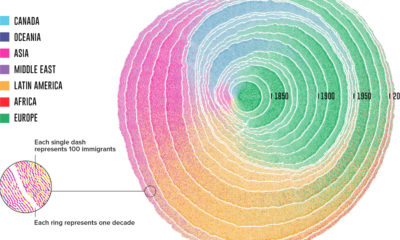
...as natural contributors to the growth of a trunk that is the United States. It’s no wonder that this animation showing U.S. immigration won Gold for...
How did Tesla accelerate from 0-60 mph in such a short period of time? Today’s five-minute-long animation is presented in association with Global Energy Metals, and...