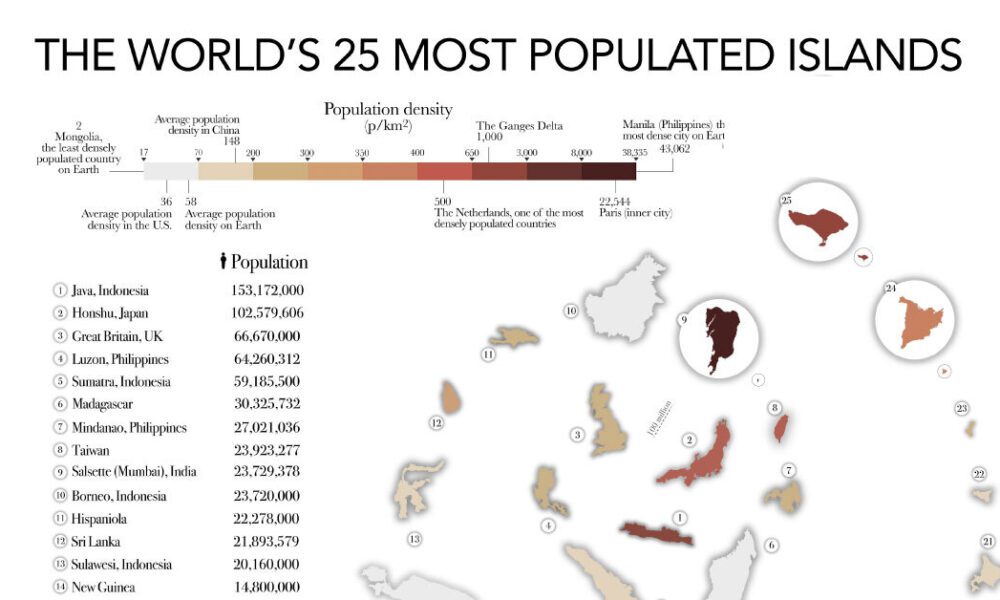
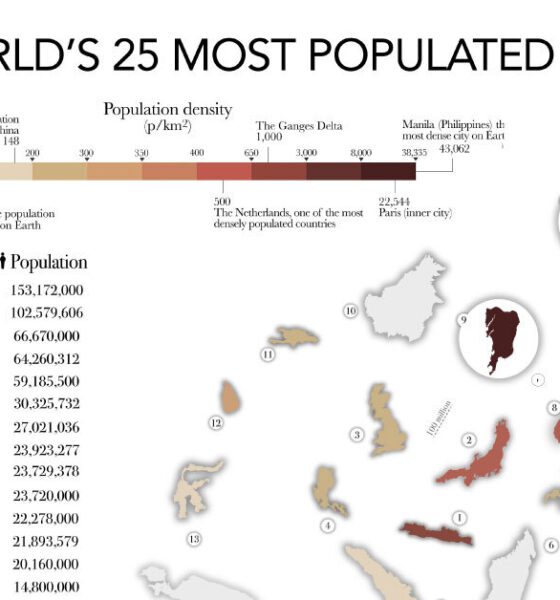

The most populated islands of the earth are teeming hubs of human activity, a far cry from the remote paradises...
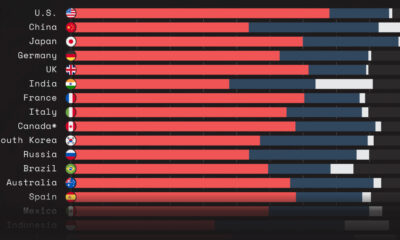

This graphic shows GDP by country, broken down into three main sectors: services, industry, and agriculture.
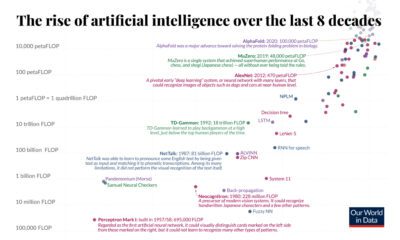

In eight decades, artificial intelligence has moved from purview of science fiction to reality. Here’s a quick history of AI computation.
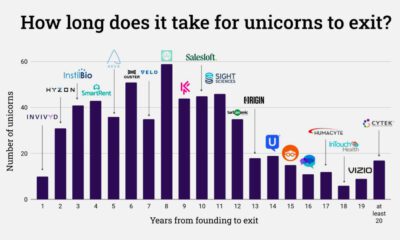

There are roughly 1,400 unicorns—startups worth $1 billion or more. How many years does it take these giants to get acquired or go public?
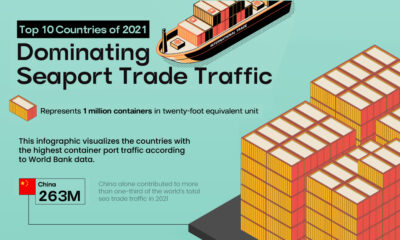

This infographic highlights the countries with the highest container traffic across their ports, thus dominating seaport trade in 2021.
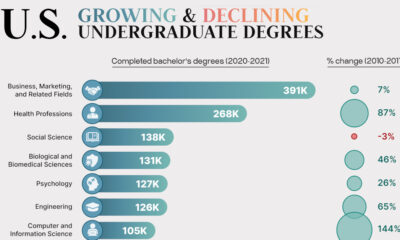

Which degrees have increased in popularity over the last decade? And which disciplines have seen fewer and fewer students?
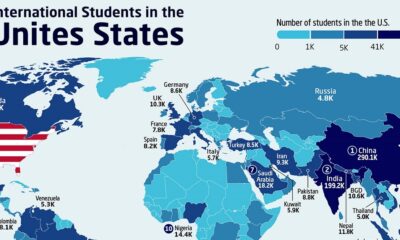

Nearly one million international students are enrolled at U.S. colleges and universities. Where do they all come from?
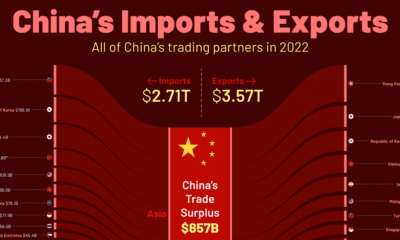

China trades with more than 200 countries globally. Here's how China's trade partners break down by import and export destinations.
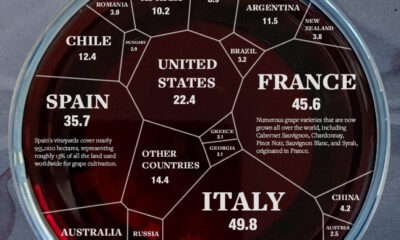

We break down the major wine producers of the world by country and how much they contribute to world wine supply.
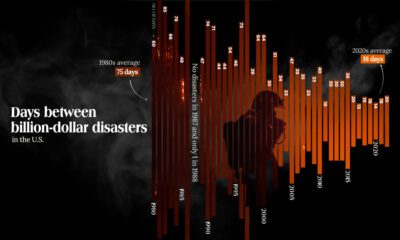

The Maui fire is the latest of many disasters in the U.S. And data shows that frequency of costly weather disasters has increased.
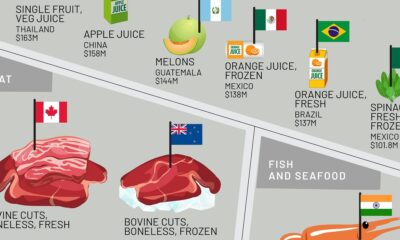

This infographic shows the top exporting countries for U.S. food imports, ranging from exotic fruits to meat, oils, spices, and more.