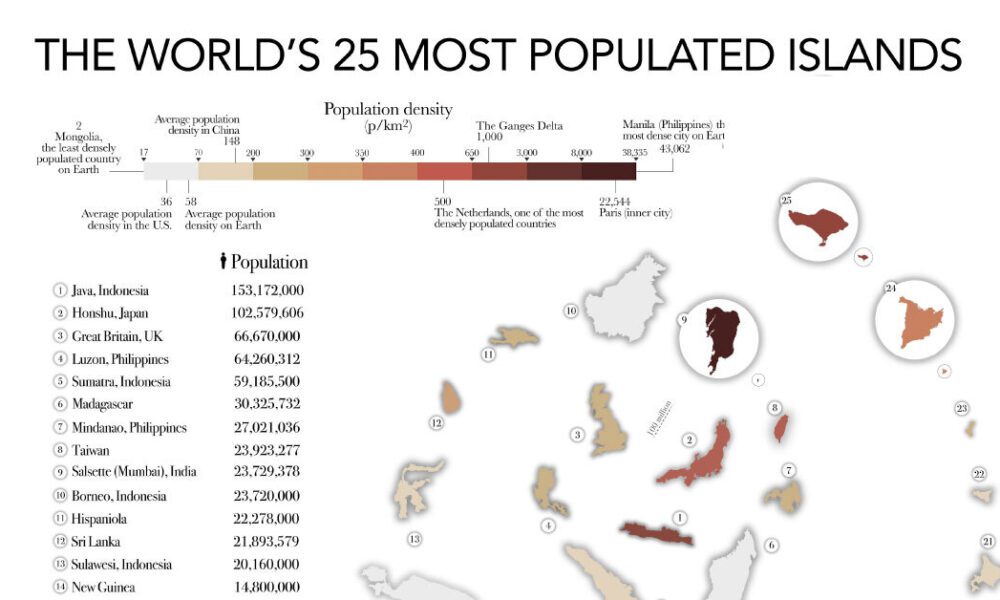
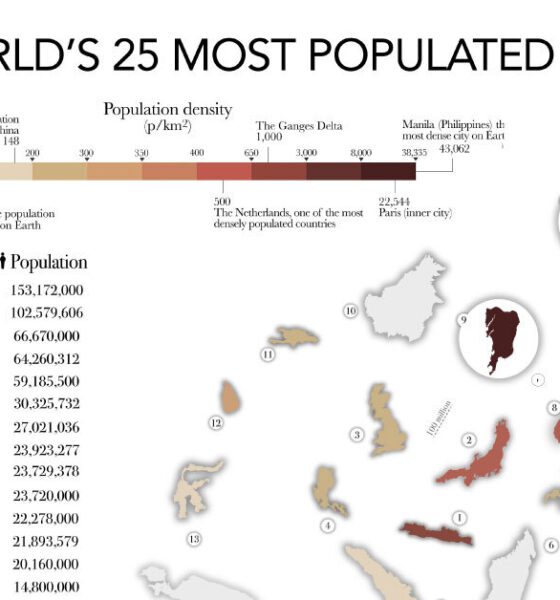

The most populated islands of the earth are teeming hubs of human activity, a far cry from the remote paradises...


From Eli Lilly to Pfizer, this graphic shows the largest pharmaceutical companies around the world by region.


Commercial jet purchases boomed in 2023. Here are the top airlines that ordered aircraft amid surging travel demand last year.
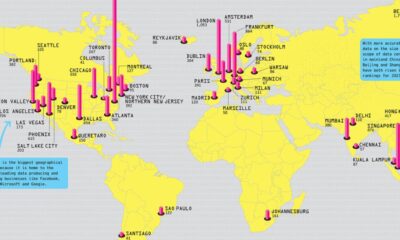

Where does the internet live? This graphic highlights the biggest data center markets in the world by electricity consumption.
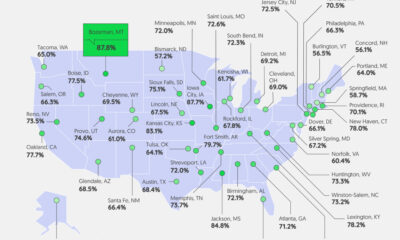

Good pay can help manage first-job worries. We visualize how geography affects entry-level pay across the U.S.
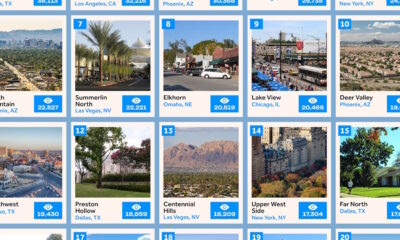

This infographic ranks the 20 most popular neighborhoods in the U.S. for homebuyers based on search interest.
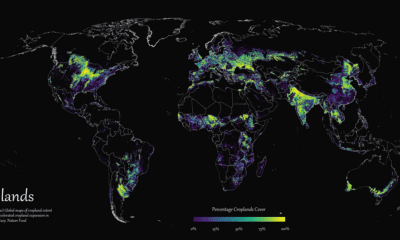

Where are the world's croplands located? This detailed map highlights the world’s cropland cover as of 2019.
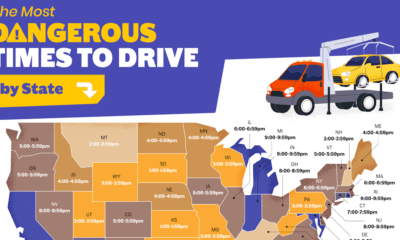

When is the most dangerous time to drive on American roads? We break down the data by hour, day, month, and state.
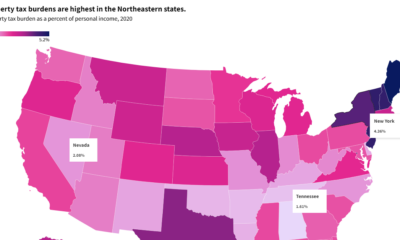

This interactive graphic shows property taxes by state in the U.S. as a percentage of personal income in 2020.


These graphics reveal how many people get depression over the course of their lives, broken down by age and sex.