Agriculture
Ranked: World’s Biggest Wine Producers by Country

Ranked: World’s Biggest Wine Producers By Country
“Wine gives a man fresh strength when he is wearied”—Homer, The Iliad
Wine has been in our cups, in our thoughts, and in our poems for many a millennia, from the antics of Dionysus, the Greek god of wine, to its symbolism in the Last Supper. But breaking down the biggest wine producers by country in the modern era leads to some interesting surprises.
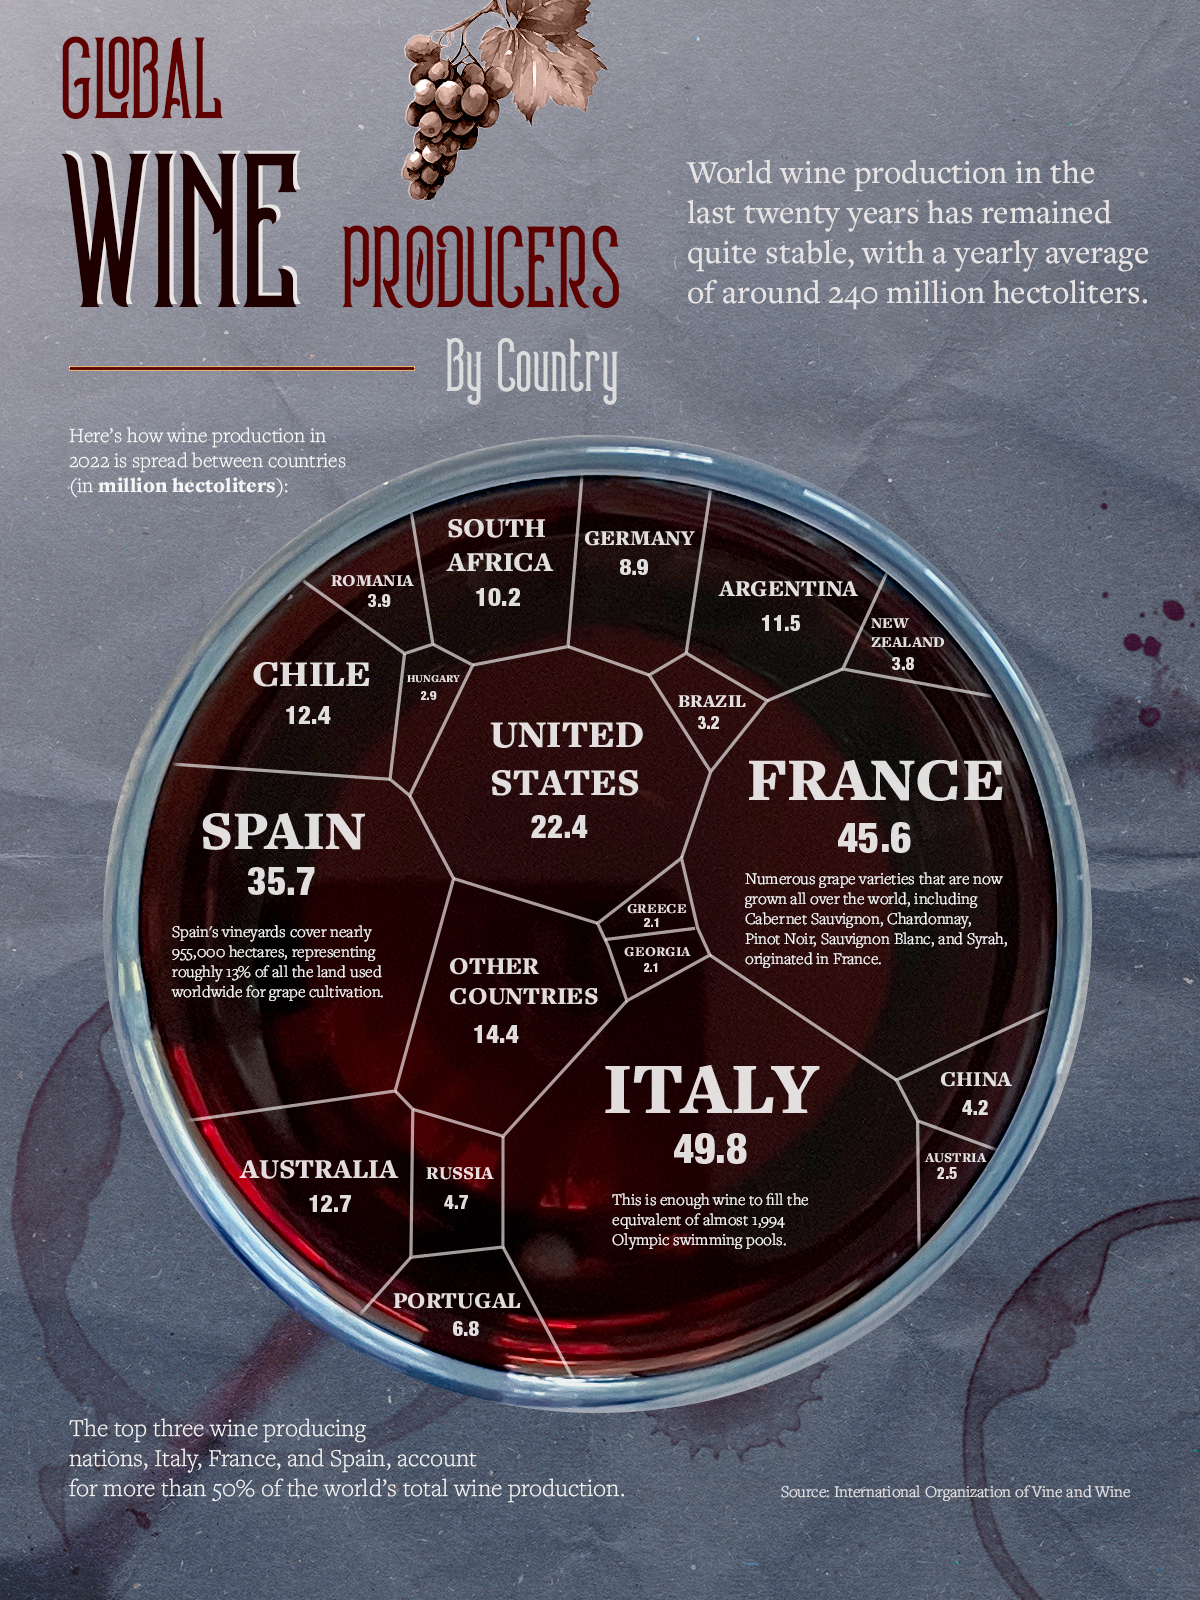
This infographic by Alberto Rojo Moro uses data from the International Organization of Vine and Wine (OIV) to visualize where wine production is concentrated in the world.
We take a quick look below.
The Top Wine Producers By Country in 2022
At the top of the list, Italy produced nearly 50 million hectoliters—or about 1,994 Olympic-sized swimming pools—of wine in 2022, accounting for nearly one-fifth of total production in the year. Less than half of that wine was sent to overseas markets, also making Italy the biggest exporter of the beverage by volume.
The country’s long coastline results in a moderate climate, allowing winemaking to occur in 20 different regions in Italy, with Veneto, Apulia, Emilia-Romagna, and Sicily leading in production.
Other known wine connoisseur countries—France (45.6 hectoliters) and Spain (35.8 million hectoliters)—rank second and third in wine production respectively. Together these three countries make up half of the world’s wine supply.
Here’s a full list of the world’s biggest wine producers by country.
| Rank | Country | Continent | Quantity (1,000 hl) | % of Total Production |
|---|---|---|---|---|
| 1 | 🇮🇹 Italy | Europe | 49,843 | 19.30% |
| 2 | 🇫🇷 France | Europe | 45,590 | 17.65% |
| 3 | 🇪🇸 Spain | Europe | 35,703 | 13.82% |
| 4 | 🇺🇸 U.S. | America | 22,385 | 8.67% |
| 5 | 🇦🇺 Australia | Oceania | 12,745 | 4.93% |
| 6 | 🇨🇱 Chile | America | 12,444 | 4.82% |
| 7 | 🇦🇷 Argentina | America | 11,451 | 4.43% |
| 8 | 🇿🇦 South Africa | Africa | 10,155 | 3.93% |
| 9 | 🇩🇪 Germany | Europe | 8,940 | 3.46% |
| 10 | 🇵🇹 Portugal | Europe | 6,777 | 2.62% |
| 11 | 🇷🇺 Russia | Europe | 4,700 | 1.82% |
| 12 | 🇨🇳 China | Asia | 4,182 | 1.62% |
| 13 | 🇳🇿 New Zealand | Oceania | 3,830 | 1.48% |
| 14 | 🇷🇴 Romania | Europe | 3,788 | 1.47% |
| 15 | 🇧🇷 Brazil | America | 3,200 | 1.24% |
| 16 | 🇭🇺 Hungary | Europe | 2,900 | 1.12% |
| 17 | 🇦🇹 Austria | Europe | 2,527 | 0.98% |
| 18 | 🇬🇪 Georgia | Europe | 2,135 | 0.83% |
| 19 | 🇬🇷 Greece | Europe | 2,127 | 0.82% |
| 20 | 🇲🇩 Moldova | Europe | 1,400 | 0.54% |
| 21 | 🇨🇭 Switzerland | Europe | 992 | 0.38% |
| 22 | 🇲🇰 North Macedonia | Europe | 936 | 0.36% |
| 23 | 🇯🇵 Japan | Asia | 830 | 0.32% |
| 24 | 🇵🇪 Peru | America | 810 | 0.31% |
| 25 | 🇺🇾 Uruguay | America | 756 | 0.29% |
| 26 | 🇧🇬 Bulgaria | Europe | 747 | 0.29% |
| 27 | 🇨🇦 Canada | America | 692 | 0.27% |
| 28 | 🇺🇦 Ukraine | Europe | 660 | 0.26% |
| 29 | 🇹🇷 Türkiye | Asia | 622 | 0.24% |
| 30 | 🇨🇿 Czech Republic | Europe | 586 | 0.23% |
| 31 | 🇭🇷 Croatia | Europe | 561 | 0.22% |
| 32 | 🇸🇮 Slovenia | Europe | 546 | 0.21% |
| 33 | 🇰🇿 Kazakhstan | Asia | 445 | 0.17% |
| 34 | 🇮🇱 Israel | Asia | 430 | 0.17% |
| 35 | 🇲🇦 Morocco | Africa | 418 | 0.16% |
| 36 | 🇹🇲 Turkmenistan | Asia | 400 | 0.15% |
| 37 | 🇲🇽 Mexico | America | 396 | 0.15% |
| 38 | 🇹🇳 Tunisia | Africa | 370 | 0.14% |
| 39 | 🇧🇾 Belarus | Europe | 340 | 0.13% |
| 40 | 🇸🇰 Slovakia | Europe | 334 | 0.13% |
| 41 | 🇦🇱 Albania | Europe | 228 | 0.09% |
| 42 | 🇺🇿 Uzbekistan | Asia | 216 | 0.08% |
| 43 | 🇩🇿 Algeria | Africa | 193 | 0.07% |
| 44 | 🇮🇳 India | Asia | 180 | 0.07% |
| 45 | 🇬🇧 UK | Europe | 91 | 0.04% |
| 46 | 🇱🇺 Luxembourg | Europe | 85 | 0.03% |
| 47 | 🇨🇾 Cyprus | Europe | 79 | 0.03% |
| 48 | 🇱🇹 Lithuania | Europe | 32 | 0.01% |
| 49 | 🇧🇪 Belgium | Europe | 30 | 0.01% |
| 50 | 🇲🇹 Malta | Europe | 13 | 0.01% |
| 51 | 🇳🇱 Netherlands | Europe | 10 | 0.00% |
| 52 | 🇵🇱 Poland | Europe | 5 | 0.00% |
| 53 | 🇩🇰 Denmark | Europe | 1 | 0.00% |
| 🌎 World | All | 258,265 | 100% |
Note: Percentages may not sum to 100% due to rounding.
The U.S., ranked 4th, is the top wine producer from the Americas, beating out other wine-producing countries like Chile (6th) and Argentina (7th).
South Africa, ranked 8th, is one of only four African countries in the dataset as winemaking isn’t as widespread on the continent as other regions in the world.
Meanwhile, China (ranked 12th) is the top wine producer from Asia. The region’s preference for other distilled spirits helps explain why the next two biggest Asian wine producers, Japan (23rd) and Türkiye (29th) occupy the middle ranks.
Unsurprisingly, European countries account for two-thirds of the world’s wine supply, followed by the Americas (20%) and then Oceania (6%).
Climate Concerns for Future Wine Production
Wine production has stayed relatively stable for the last decade but climate change is coming for this industry as well.
According to the New York Times, warmer temperatures are both a blessing and curse for winemakers. Some areas once deemed too inhospitable for grapevines (like England) are starting to show potential for certain varietals and wines. At the same time, in some traditional regions, prolonged warmer weather is leading to overripening, forcing winemakers to limit the grapes’ exposure to sunlight.
And the general weather anomalies caused by climate change—floods, droughts, wildfires—all make wine production just a little more difficult than it already is.
Which prompts a question worth pouring a glass of wine over to ponder: which wine producing countries will survive, adapt, languish or thrive in the coming decades?

This article was published as a part of Visual Capitalist's Creator Program, which features data-driven visuals from some of our favorite Creators around the world.
Markets
The World’s Top Cocoa Producing Countries
Here are the largest cocoa producing countries globally—from Côte d’Ivoire to Brazil—as cocoa prices hit record highs.

The World’s Top Cocoa Producing Countries
This was originally posted on our Voronoi app. Download the app for free on iOS or Android and discover incredible data-driven charts from a variety of trusted sources.
West Africa is home to the largest cocoa producing countries worldwide, with 3.9 million tonnes of production in 2022.
In fact, there are about one million farmers in Côte d’Ivoire supplying cocoa to key customers such as Nestlé, Mars, and Hershey. But the massive influence of this industry has led to significant forest loss to plant cocoa trees.
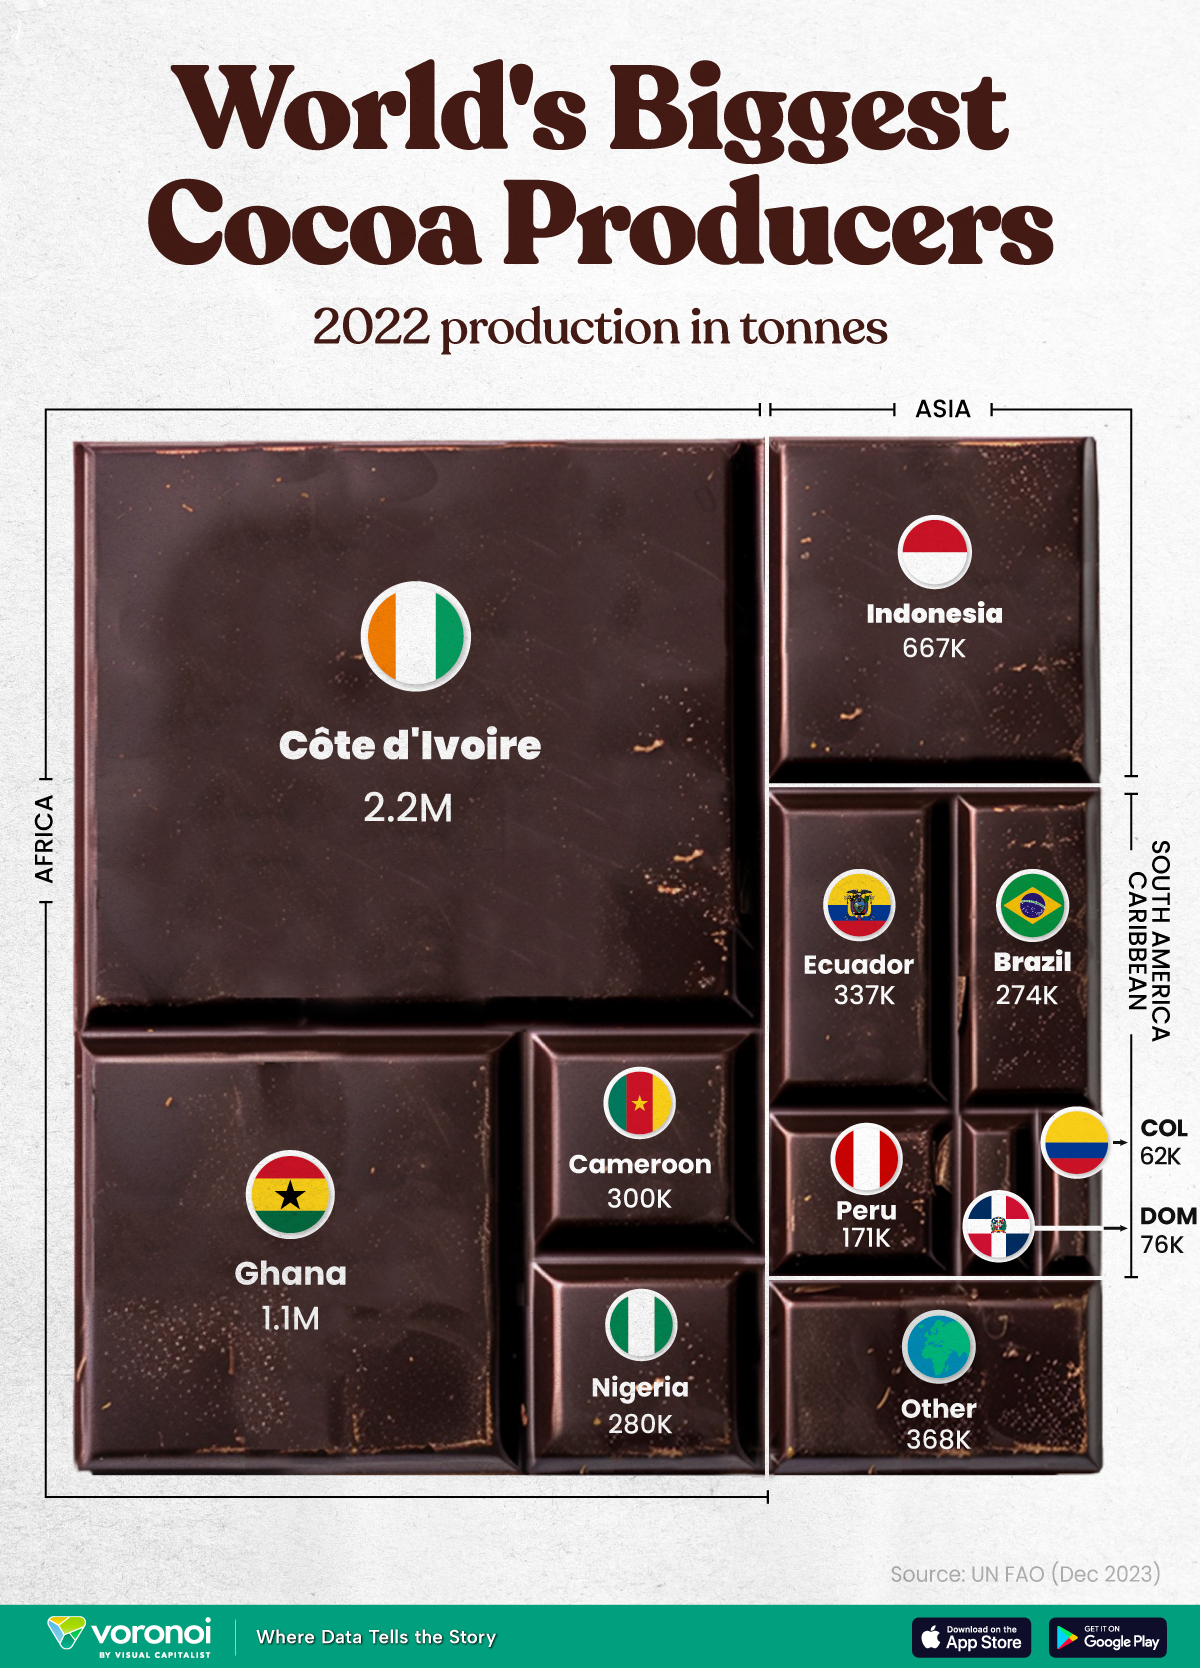
This graphic shows the leading producers of cocoa, based on data from the UN FAO.
Global Hotspots for Cocoa Production
Below, we break down the top cocoa producing countries as of 2022:
| Country | 2022 Production, Tonnes |
|---|---|
| 🇨🇮 Côte d'Ivoire | 2.2M |
| 🇬🇭 Ghana | 1.1M |
| 🇮🇩 Indonesia | 667K |
| 🇪🇨 Ecuador | 337K |
| 🇨🇲 Cameroon | 300K |
| 🇳🇬 Nigeria | 280K |
| 🇧🇷 Brazil | 274K |
| 🇵🇪 Peru | 171K |
| 🇩🇴 Dominican Republic | 76K |
| 🌍 Other | 386K |
With 2.2 million tonnes of cocoa in 2022, Côte d’Ivoire is the world’s largest producer, accounting for a third of the global total.
For many reasons, the cocoa trade in Côte d’Ivoire and Western Africa has been controversial. Often, farmers make about 5% of the retail price of a chocolate bar, and earn $1.20 each day. Adding to this, roughly a third of cocoa farms operate on forests that are meant to be protected.
As the third largest producer, Indonesia produced 667,000 tonnes of cocoa with the U.S., Malaysia, and Singapore as major importers. Overall, small-scale farmers produce 95% of cocoa in the country, but face several challenges such as low pay and unwanted impacts from climate change. Alongside aging trees in the country, these setbacks have led productivity to decline.
In South America, major producers include Ecuador and Brazil. In the early 1900s, Ecuador was the world’s largest cocoa producing country, however shifts in the global marketplace and crop disease led its position to fall. Today, the country is most known for its high-grade single-origin chocolate, with farms seen across the Amazon rainforest.
Altogether, global cocoa production reached 6.5 million tonnes, supported by strong demand. On average, the market has grown 3% annually over the last several decades.
-

 Education1 week ago
How Hard Is It to Get Into an Ivy League School?
-

 Technology2 weeks ago
Ranked: Semiconductor Companies by Industry Revenue Share
-

 Markets2 weeks ago
Ranked: The World’s Top Flight Routes, by Revenue
-

 Demographics2 weeks ago
Population Projections: The World’s 6 Largest Countries in 2075
-

 Markets2 weeks ago
The Top 10 States by Real GDP Growth in 2023
-

 Demographics2 weeks ago
The Smallest Gender Wage Gaps in OECD Countries
-

 Economy2 weeks ago
Where U.S. Inflation Hit the Hardest in March 2024
-

 Environment2 weeks ago
Top Countries By Forest Growth Since 2001


