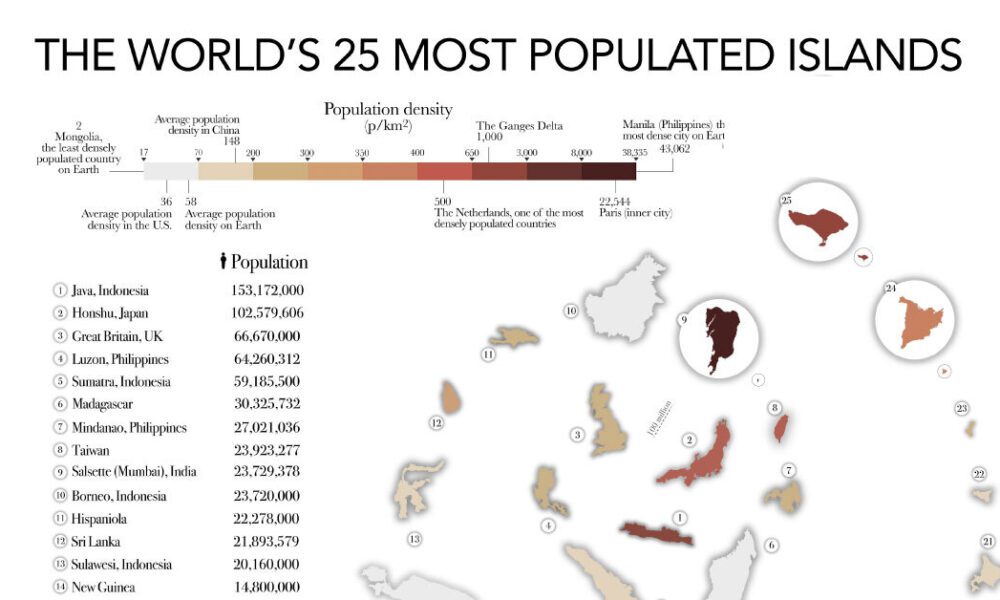
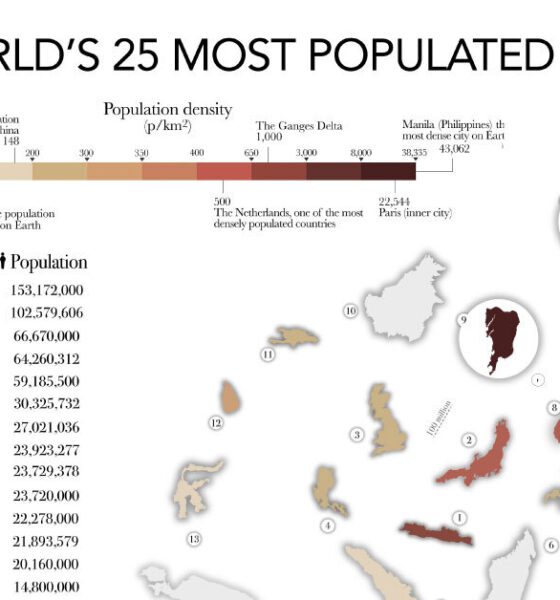

The most populated islands of the earth are teeming hubs of human activity, a far cry from the remote paradises...
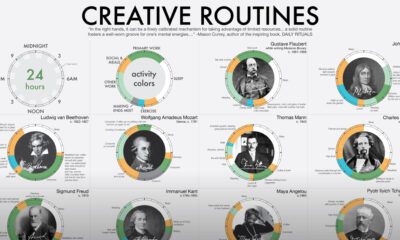

The daily routines of 16 famous creatives—poets, thinkers, scientists and even politicians—are charted for comparison with each other.
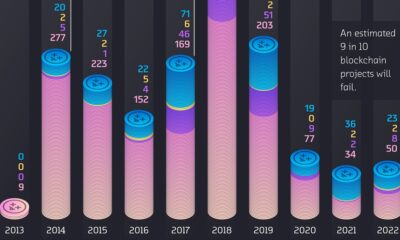

We visualize over 2,000 crypto failures by year of death, and year of project origin. See how and why crypto projects die in these charts.
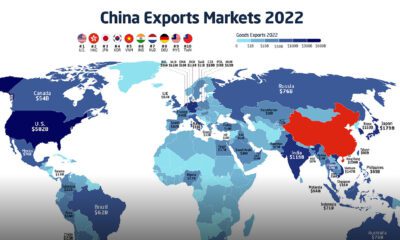

In 2022, China exported $3.6 trillion of goods, more than the GDP of the UK or India. Here's how Chinese exports have evolved since 2001.
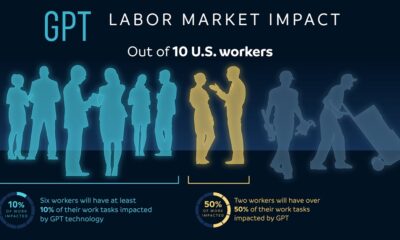

OpenAI, the creators of ChatGPT, have authored a research paper that tries to predict the impact of AI on the job market.
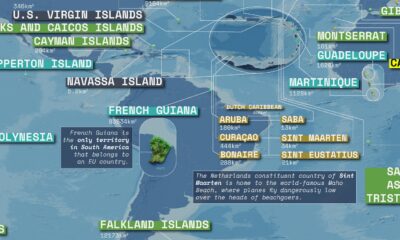

This massive map highlights overseas territories and dependencies around the world and their sovereign states.
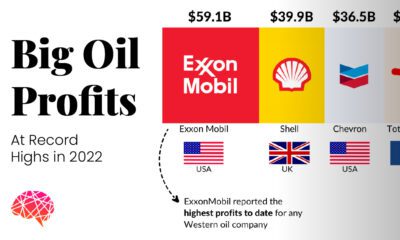

This visual highlights the five big oil companies that doubled their individual profits and earned a cumulative profit of over $200 billion in 2022.
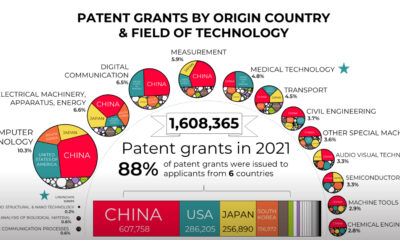

Which countries, and technologies, are being granted the most new patents? This graphic visualizes patent grants by country of origin.


How does the $6.1 billion Washington Commanders sale measure up against the most expensive sports team sales in history?
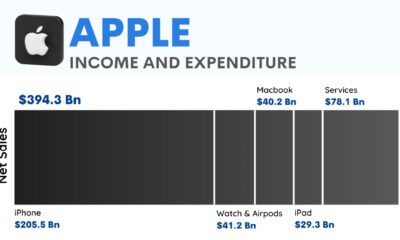

How does the world's largest tech company make its billions? This graphic charts Apple's profit in 2022 totaling $100 billion.
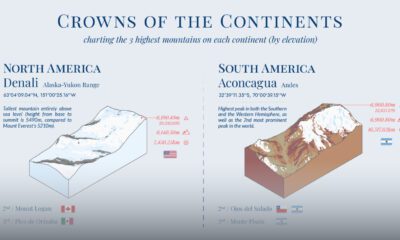

What are the highest mountains in different parts of the world? This visual maps the three tallest mountains by elevation in each continent.