Technology
Charting the Number of Failed Crypto Coins, by Year (2013-2022)
Article/Editing:
The Number of Failed Crypto Coins, by Year (2013-2022)
Ever since the first major crypto boom in 2011, tens of thousands of cryptocurrency coins have been released to market.
And while some cryptocurrencies performed well, others have ceased to trade or have ended up as failed or abandoned projects.
These graphics from CoinKickoff break down the number of failed crypto coins by the year they died, and the year they started. The data covers a decade of coin busts from 2013 through 2022.
Methodology
What is the marker of a “dead” crypto coin?
This analysis reviewed data from failed crypto coins listed on Coinopsy and cross-referenced against CoinMarketCap to verify previous market activity. The reason for each coin death was also tabulated, including:
- Failed Initial Coin Offerings (ICOs)
- Abandonment with less than $1,000 in trade volume over a three-month period
- Scams or coins that were meant as a joke
Dead Crypto Coins from 2013 to 2022
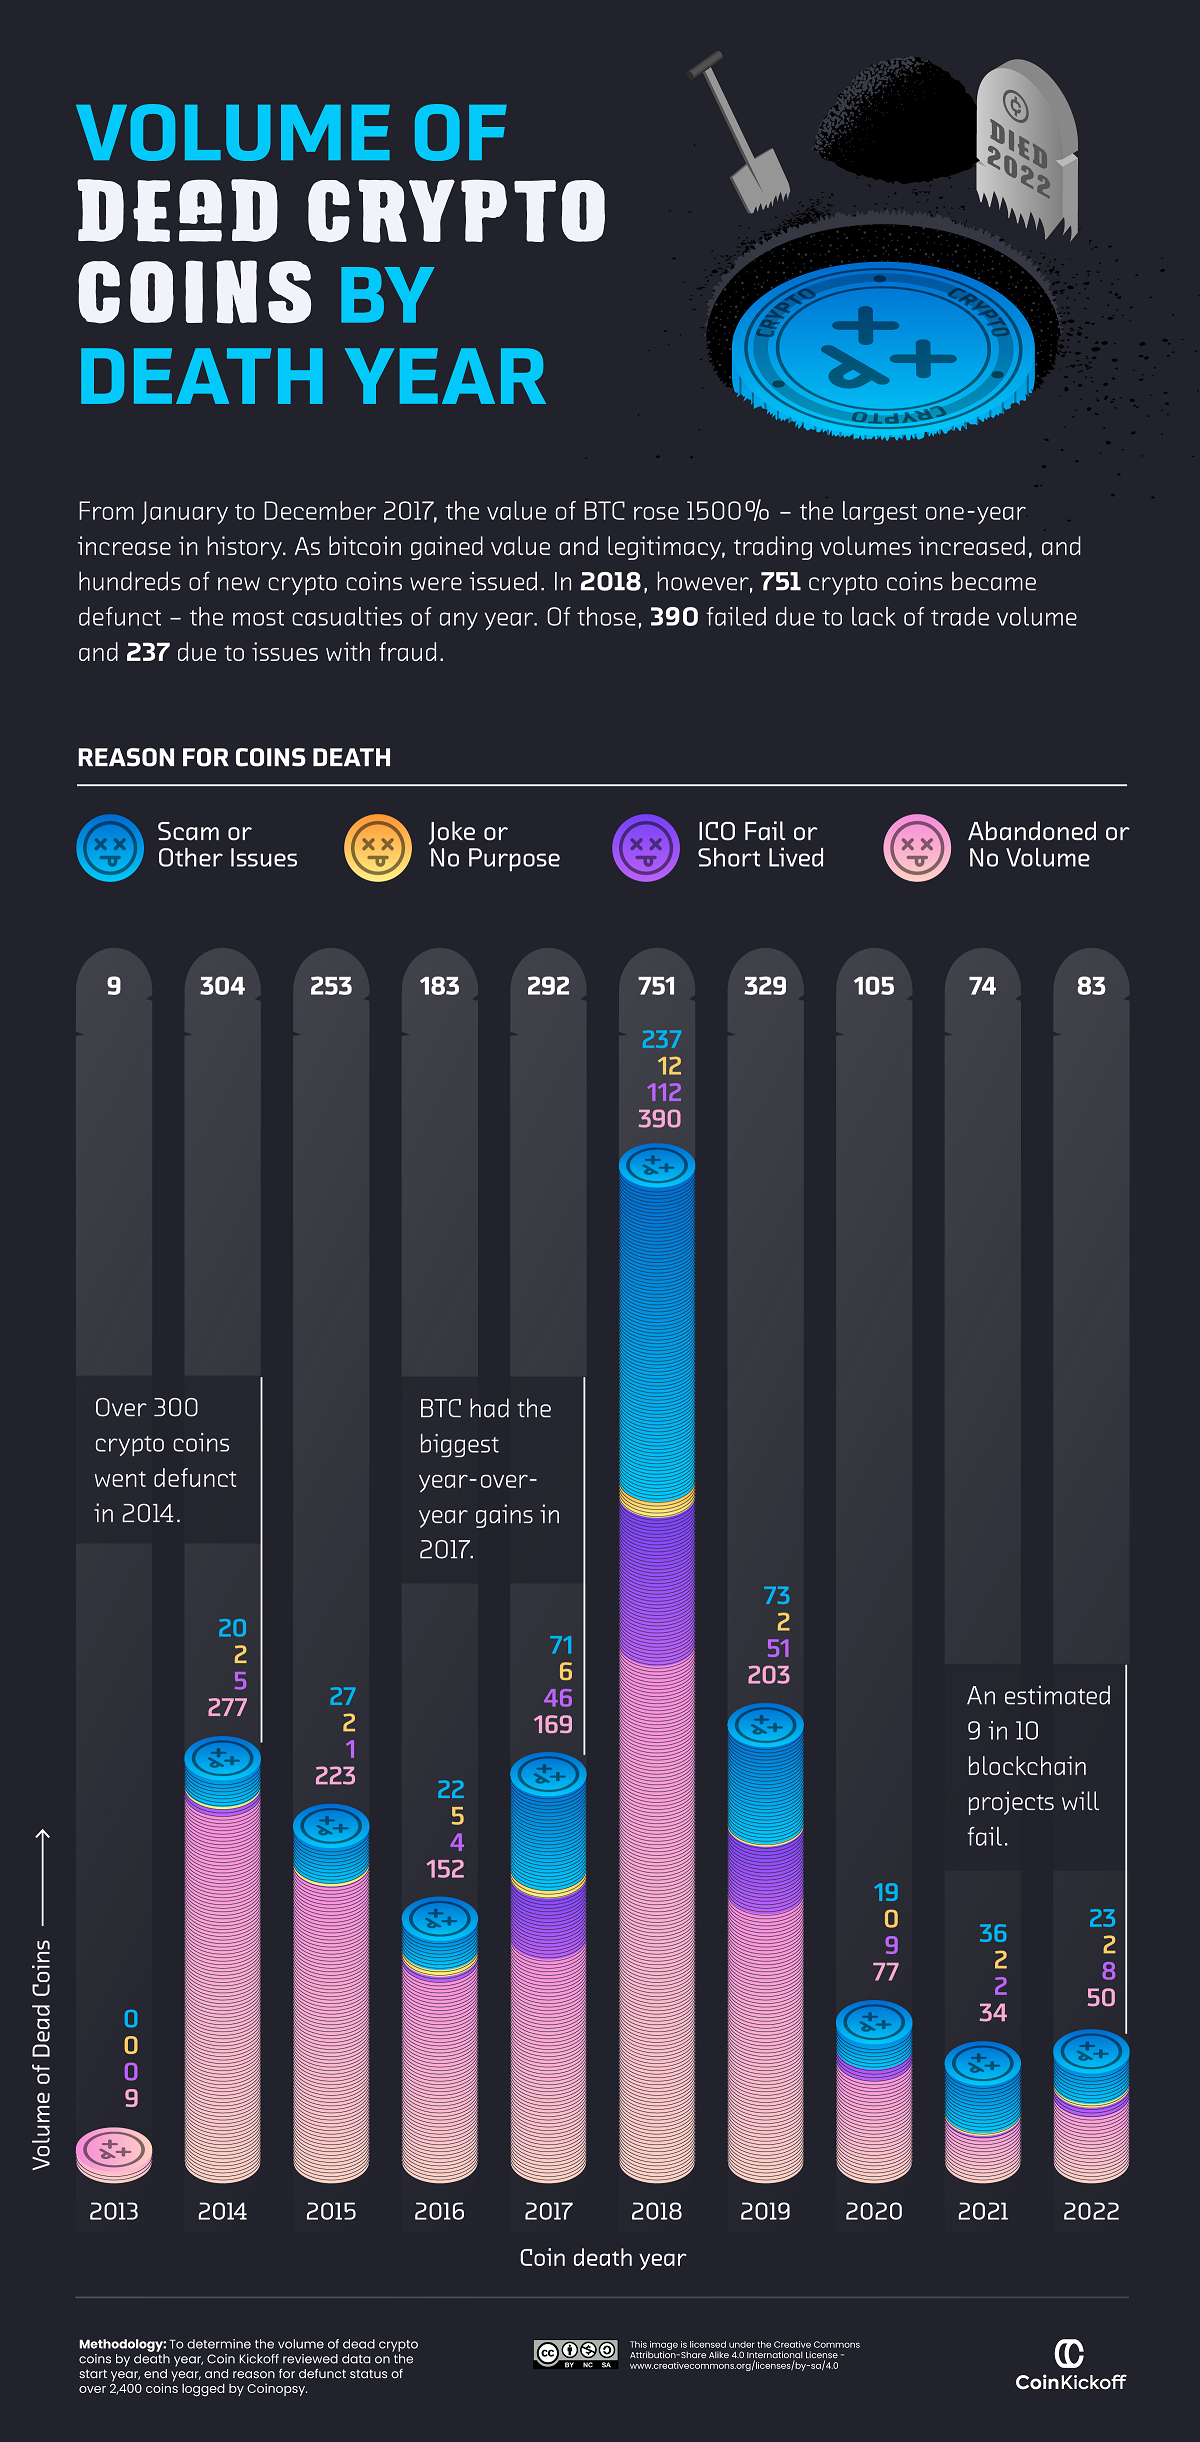
While many familiar crypto coins—Litecoin, Dogecoin, and Ethereum—are still on the market today, there were at least 2,383 crypto coins that bit the dust between 2013 and 2022.
Here’s a breakdown of how many crypto coins died each year by reason:
| Dead Coins by Year | Abandoned / No Volume | Scams / Other Issues | ICO Failed / Short-Lived | Joke / No purpose |
|---|---|---|---|---|
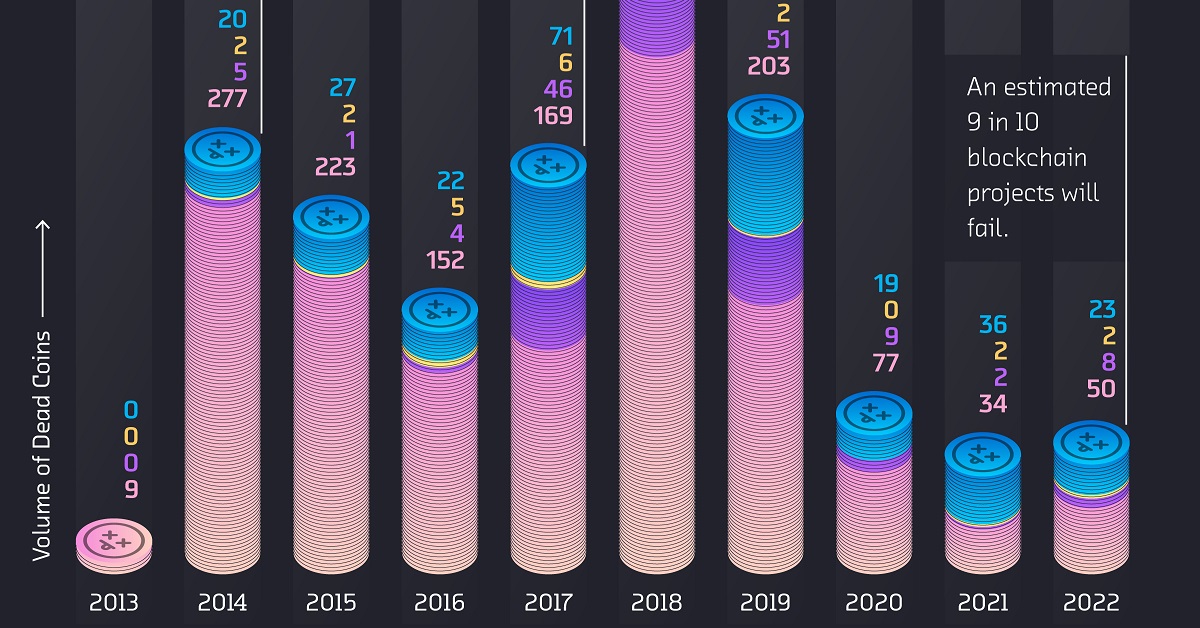
| 2013 | 9 | 0 | 0 | 0 |
| 2014 | 277 | 20 | 5 | 2 |
| 2015 | 223 | 27 | 1 | 2 |
| 2016 | 152 | 22 | 4 | 5 |
| 2017 | 169 | 71 | 46 | 6 |
| 2018 | 390 | 237 | 112 | 12 |
| 2019 | 203 | 73 | 51 | 2 |
| 2020 | 77 | 19 | 9 | 0 |
| 2021 | 34 | 36 | 2 | 2 |
| 2022 | 50 | 23 | 8 | 2 |
| Total | 1,584 | 528 | 238 | 33 |
Abandoned coins with flatlining trading volume accounted for 1,584 or 66.5% of analyzed crypto failures over the last decade. Comparatively, 22% ended up being scam coins, and 10% failed to launch after an ICO.
As for individual years, 2018 saw the largest total of annual casualties in the crypto market, with 751 dead crypto coins. More than half of them were abandoned by investors, but 237 coins were revealed as scams or embroiled in other controversies, such as BitConnect which turned out to be a Ponzi scheme.
Why was 2018 such a big year for crypto failures?
This is largely because the year prior saw Bitcoin prices climb above $1,000 for the first time with an eventual peak near $19,000. As a result, speculation ran hot, new crypto issuances boomed, and many investors and firms got bullish on the market for the first time.
How Many Newly Launched Coins Died?
Of the hundreds of coins that launched in 2017, more than half were considered defunct by the end of 2022.
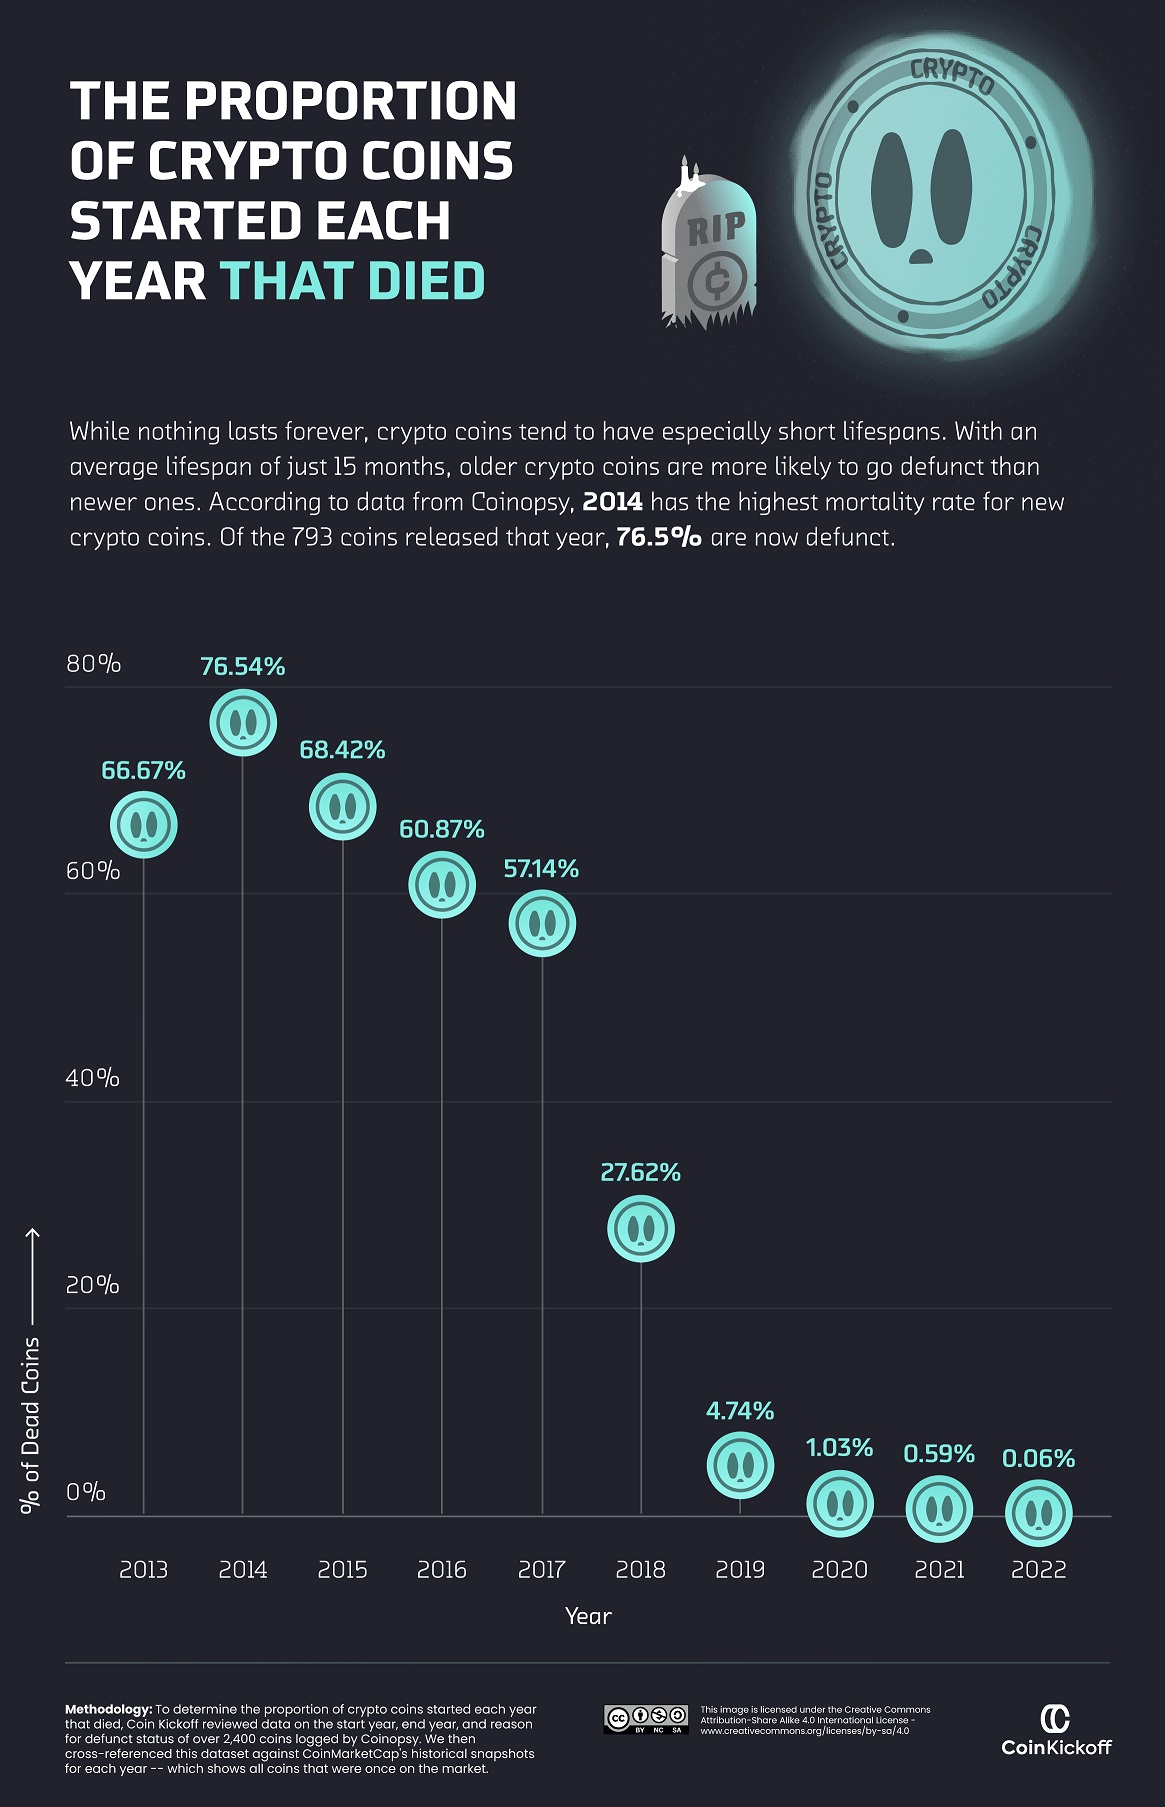
Indeed, a lot of earlier-launched coins have since died. The majority of coins launched between 2013 and 2017 have already become “dead coins” by the end of 2022.
| Coin Start Year | Dead Coins by 2022 |
|---|---|
| 2013 | 66.67% |
| 2014 | 76.54% |
| 2015 | 68.42% |
| 2016 | 60.87% |
| 2017 | 57.14% |
| 2018 | 27.62% |
| 2019 | 4.74% |
| 2020 | 1.03% |
| 2021 | 0.59% |
| 2022 | 0.06% |
Part of this is because the cryptocurrency field itself was still being figured out. Many coins were launched in a time of experimentation and innovation, but also of volatility and uncertainty.
However, the trend began to shift in 2018. Only 27.62% of coins launched in that year have bit the dust so far, and the failure rates in 2019 and 2020 fell further to only 4.74% and 1.03% of launched coins, respectively.
This suggests that the crypto industry has become more mature and stable, with newer projects establishing themselves more securely and investors becoming wiser to potential scams.
How will this trend evolve into 2023 and beyond?

This article was published as a part of Visual Capitalist's Creator Program, which features data-driven visuals from some of our favorite Creators around the world.


Technology
Ranked: Semiconductor Companies by Industry Revenue Share
Nvidia is coming for Intel’s crown. Samsung is losing ground. AI is transforming the space. We break down revenue for semiconductor companies.


Semiconductor Companies by Industry Revenue Share
This was originally posted on our Voronoi app. Download the app for free on Apple or Android and discover incredible data-driven charts from a variety of trusted sources.
Did you know that some computer chips are now retailing for the price of a new BMW?
As computers invade nearly every sphere of life, so too have the chips that power them, raising the revenues of the businesses dedicated to designing them.
But how did various chipmakers measure against each other last year?
We rank the biggest semiconductor companies by their percentage share of the industry’s revenues in 2023, using data from Omdia research.
Which Chip Company Made the Most Money in 2023?
Market leader and industry-defining veteran Intel still holds the crown for the most revenue in the sector, crossing $50 billion in 2023, or 10% of the broader industry’s topline.
All is not well at Intel, however, with the company’s stock price down over 20% year-to-date after it revealed billion-dollar losses in its foundry business.
| Rank | Company | 2023 Revenue | % of Industry Revenue |
|---|---|---|---|
| 1 | Intel | $51B | 9.4% |
| 2 | NVIDIA | $49B | 9.0% |
| 3 | Samsung Electronics | $44B | 8.1% |
| 4 | Qualcomm | $31B | 5.7% |
| 5 | Broadcom | $28B | 5.2% |
| 6 | SK Hynix | $24B | 4.4% |
| 7 | AMD | $22B | 4.1% |
| 8 | Apple | $19B | 3.4% |
| 9 | Infineon Tech | $17B | 3.2% |
| 10 | STMicroelectronics | $17B | 3.2% |
| 11 | Texas Instruments | $17B | 3.1% |
| 12 | Micron Technology | $16B | 2.9% |
| 13 | MediaTek | $14B | 2.6% |
| 14 | NXP | $13B | 2.4% |
| 15 | Analog Devices | $12B | 2.2% |
| 16 | Renesas Electronics Corporation | $11B | 1.9% |
| 17 | Sony Semiconductor Solutions Corporation | $10B | 1.9% |
| 18 | Microchip Technology | $8B | 1.5% |
| 19 | Onsemi | $8B | 1.4% |
| 20 | KIOXIA Corporation | $7B | 1.3% |
| N/A | Others | $126B | 23.2% |
| N/A | Total | $545B | 100% |
Note: Figures are rounded. Totals and percentages may not sum to 100.
Meanwhile, Nvidia is very close to overtaking Intel, after declaring $49 billion of topline revenue for 2023. This is more than double its 2022 revenue ($21 billion), increasing its share of industry revenues to 9%.
Nvidia’s meteoric rise has gotten a huge thumbs-up from investors. It became a trillion dollar stock last year, and broke the single-day gain record for market capitalization this year.
Other chipmakers haven’t been as successful. Out of the top 20 semiconductor companies by revenue, 12 did not match their 2022 revenues, including big names like Intel, Samsung, and AMD.
The Many Different Types of Chipmakers
All of these companies may belong to the same industry, but they don’t focus on the same niche.
According to Investopedia, there are four major types of chips, depending on their functionality: microprocessors, memory chips, standard chips, and complex systems on a chip.
Nvidia’s core business was once GPUs for computers (graphics processing units), but in recent years this has drastically shifted towards microprocessors for analytics and AI.
These specialized chips seem to be where the majority of growth is occurring within the sector. For example, companies that are largely in the memory segment—Samsung, SK Hynix, and Micron Technology—saw peak revenues in the mid-2010s.

-

 Green2 weeks ago
Ranked: Top Countries by Total Forest Loss Since 2001
-

 Travel1 week ago
Ranked: The World’s Top Flight Routes, by Revenue
-

 Technology1 week ago
Ranked: Semiconductor Companies by Industry Revenue Share
-

 Money2 weeks ago
Which States Have the Highest Minimum Wage in America?
-

 Real Estate2 weeks ago
Ranked: The Most Valuable Housing Markets in America
-

 Markets2 weeks ago
Charted: Big Four Market Share by S&P 500 Audits
-

 AI2 weeks ago
The Stock Performance of U.S. Chipmakers So Far in 2024
-

 Automotive2 weeks ago
Almost Every EV Stock is Down After Q1 2024