Politics
The Cost and Composition of America’s Nuclear Weapons Arsenal
The American nuclear weapons arsenal is nowhere near its 1960s peak, but there are still thousands of warheads in the stockpile today.
The U.S. nuclear program is comprised of a complex network of facilities and weaponry, and of course the actual warheads themselves. Let’s look at the location of warheads, how they’re deployed, and the costs associated with running and refurbishing an aging nuclear program.
Let’s launch into the data.
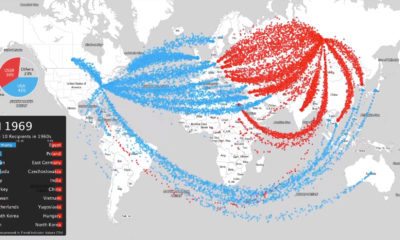
Nuclear Weapons Map
As of 2019, the U.S. Department of Defense maintained an estimated stockpile of 3,800 nuclear warheads for delivery by more than 800 ballistic missiles and aircraft. Roughly 1,300 warheads are actually deployed, while most of the remaining inventory is either held in reserve (as a hedge against “technical or geopolitical surprises”) or is destined to be dismantled.
These weapons are thought to be stored across 11 U.S. states, with the vast majority residing in New Mexico, Washington, and Georgia.
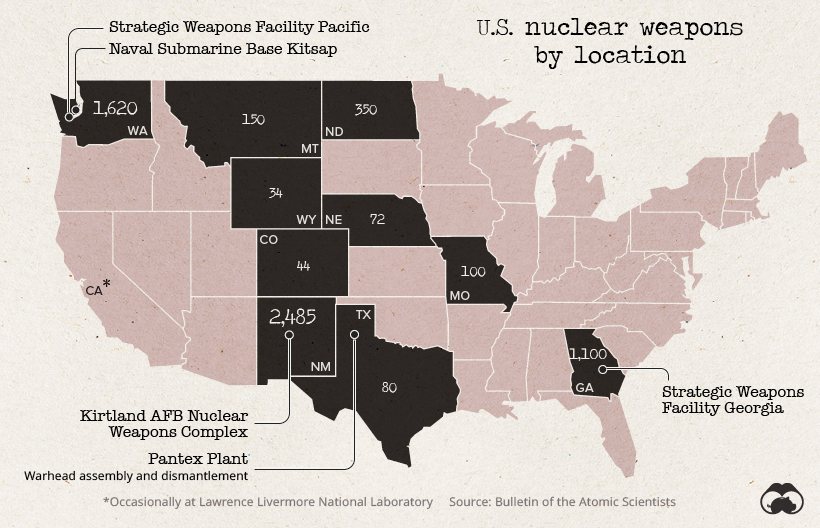
Over 1,500 of the warheads in New Mexico are retired and are destined to be dismantled at the Pantex facility in Texas.
The United States also maintains a small amount of nuclear inventory in and around Europe as well. Turkey’s Incirlik Air Base likely holds the biggest supply of warheads outside the U.S., and a few weapons are also located in storage vaults in Belgium, Italy, Germany, and the Netherlands.
Deployment Data
Nuclear warheads, while devastatingly powerful, are nothing without a delivery mechanism. In simple terms, there are three primary methods for actually launching missiles: Silos, bombers, and submarines.
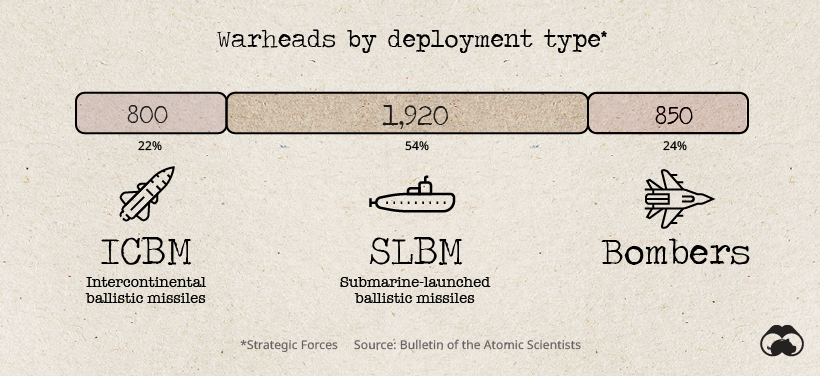
The most common deployment of nuclear weapons is under the sea. The U.S. Navy is thought to operate 14 ballistic missile submarines, with each carrying as many as 24 Trident II missiles.
Missile silos are not as popular as they once were, but the U.S. Air Force still maintains 400 silo-based missiles, and another 50 are kept “warm” in the event of an emergency.
America’s Nuclear Weapons Budget
The Congressional Budget Office (CBO) is required to project the 10-year costs of nuclear forces every two years.
Though much of the program is shrouded in secrecy, the budget below provides an overview of the costs of running America’s nuclear weapons arsenal.
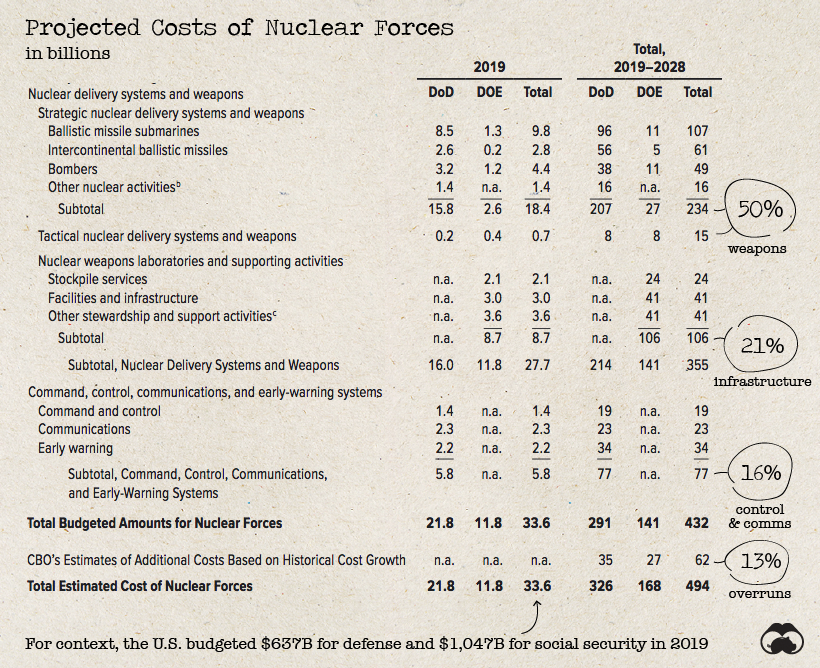
Costs in the budget are split between the Department of Energy (DoE) and the Department of Defense (DoD), which handle different parts of the process.
On one hand, the DoD takes care of the delivery systems for warheads. Those submarines, bombers, and missile silos spread around the country will add up to a projected $249 billion in costs over the next decade. Another large portion of the DoD budget accounts for operational aspects of the program, such as funding facilities, control, and early warning systems.
On the other hand, the DoE is responsible for building and maintaining the actual warheads themselves. The U.S. stopped producing new warheads in the 1990s, but all that changed last year.
Back in the Bomb Business
Generally, we think of nuclear weapons stockpiles as a sunsetting resource, slowly being dismantled; however, since the treaty that ended the arms race collapsed in mid-2019, the flood gates may be opening once again.
New warheads are reportedly rolling off the production line, and in the beginning of this year, Lockheed Martin was tapped by the U.S. Navy to manufacture low yield submarine-based nuclear missiles.
The development of lower yield nuclear weapons appears to be a response to efforts by Russia to modernize their arsenal.
Recent Russian statements […] appear to lower the threshold for Moscow’s first-use of nuclear weapons.
– Nuclear Posture Review (2018)
With this new weapons development, the U.S. is aiming to create “tailored response options” to any potential conflict. By eliminating the perceived advantages that adversaries may have, the U.S. is hoping to lower the likelihood of a nuclear conflict.
Arms control advocates warn that new lower-yield warheads entering production will lower the threshold for a nuclear conflict.
While advocates and critics of nuclear weapons debate the merits of new weapons, we appear to be entering a new era of weapons proliferation.


Economy
The Bloc Effect: International Trade with Geopolitical Allies on the Rise
Rising geopolitical tensions are shaping the future of international trade, but what is the effect on trading among G7 and BRICS countries?


The Bloc Effect: International Trade with Allies on the Rise
International trade has become increasingly fragmented over the last five years as countries have shifted to trading more with their geopolitical allies.
This graphic from The Hinrich Foundation, the first in a three-part series covering the future of trade, provides visual context to the growing divide in trade in G7 and pre-expansion BRICS countries, which are used as proxies for geopolitical blocs.
Trade Shifts in G7 and BRICS Countries
This analysis uses IMF data to examine differences in shares of exports within and between trading blocs from 2018 to 2023. For example, we looked at the percentage of China’s exports with other BRICS members as well as with G7 members to see how these proportions shifted in percentage points (pp) over time.
Countries traded nearly $270 billion more with allies in 2023 compared to 2018. This shift came at the expense of trade with rival blocs, which saw a decline of $314 billion.
Country Change in Exports Within Bloc (pp) Change in Exports With Other Bloc (pp)
🇮🇳 India 0.0 3.9
🇷🇺 Russia 0.7 -3.8
🇮🇹 Italy 0.8 -0.7
🇨🇦 Canada 0.9 -0.7
🇫🇷 France 1.0 -1.1
🇪🇺 EU 1.1 -1.5
🇩🇪 Germany 1.4 -2.1
🇿🇦 South Africa 1.5 1.5
🇺🇸 U.S. 1.6 -0.4
🇯🇵 Japan 2.0 -1.7
🇨🇳 China 2.1 -5.2
🇧🇷 Brazil 3.7 -3.3
🇬🇧 UK 10.2 0.5
All shifts reported are in percentage points. For example, the EU saw its share of exports to G7 countries rise from 74.3% in 2018 to 75.4% in 2023, which equates to a 1.1 percentage point increase.
The UK saw the largest uptick in trading with other countries within the G7 (+10.2 percentage points), namely the EU, as the post-Brexit trade slump to the region recovered.
Meanwhile, the U.S.-China trade dispute caused China’s share of exports to the G7 to fall by 5.2 percentage points from 2018 to 2023, the largest decline in our sample set. In fact, partly as a result of the conflict, the U.S. has by far the highest number of harmful tariffs in place.
The Russia-Ukraine War and ensuing sanctions by the West contributed to Russia’s share of exports to the G7 falling by 3.8 percentage points over the same timeframe.
India, South Africa, and the UK bucked the trend and continued to witness advances in exports with the opposing bloc.
Average Trade Shifts of G7 and BRICS Blocs
Though results varied significantly on a country-by-country basis, the broader trend towards favoring geopolitical allies in international trade is clear.
Bloc Change in Exports Within Bloc (pp) Change in Exports With Other Bloc (pp)
Average 2.1 -1.1
BRICS 1.6 -1.4
G7 incl. EU 2.4 -1.0
Overall, BRICS countries saw a larger shift away from exports with the other bloc, while for G7 countries the shift within their own bloc was more pronounced. This implies that though BRICS countries are trading less with the G7, they are relying more on trade partners outside their bloc to make up for the lost G7 share.
A Global Shift in International Trade and Geopolitical Proximity
The movement towards strengthening trade relations based on geopolitical proximity is a global trend.
The United Nations categorizes countries along a scale of geopolitical proximity based on UN voting records.
According to the organization’s analysis, international trade between geopolitically close countries rose from the first quarter of 2022 (when Russia first invaded Ukraine) to the third quarter of 2023 by over 6%. Conversely, trade with geopolitically distant countries declined.
The second piece in this series will explore China’s gradual move away from using the U.S. dollar in trade settlements.
Visit the Hinrich Foundation to learn more about the future of geopolitical trade

-

 Economy3 days ago
Economic Growth Forecasts for G7 and BRICS Countries in 2024
The IMF has released its economic growth forecasts for 2024. How do the G7 and BRICS countries compare?
-

 United States2 weeks ago
Ranked: The Largest U.S. Corporations by Number of Employees
We visualized the top U.S. companies by employees, revealing the massive scale of retailers like Walmart, Target, and Home Depot.
-

 Economy2 weeks ago
Where U.S. Inflation Hit the Hardest in March 2024
We visualized product categories that saw the highest % increase in price due to U.S. inflation as of March 2024.
-

 Economy1 month ago
G20 Inflation Rates: Feb 2024 vs COVID Peak
We visualize inflation rates across G20 countries as of Feb 2024, in the context of their COVID-19 pandemic peak.
-

 Economy1 month ago
Mapped: Unemployment Claims by State
This visual heatmap of unemployment claims by state highlights New York, California, and Alaska leading the country by a wide margin.
-

 Economy2 months ago
Confidence in the Global Economy, by Country
Will the global economy be stronger in 2024 than in 2023?


-

 Debt1 week ago
How Debt-to-GDP Ratios Have Changed Since 2000
-

 Markets2 weeks ago
Ranked: The World’s Top Flight Routes, by Revenue
-

 Demographics2 weeks ago
Population Projections: The World’s 6 Largest Countries in 2075
-

 Markets2 weeks ago
The Top 10 States by Real GDP Growth in 2023
-

 Demographics2 weeks ago
The Smallest Gender Wage Gaps in OECD Countries
-
Economy2 weeks ago
Where U.S. Inflation Hit the Hardest in March 2024
-

 Green2 weeks ago
Top Countries By Forest Growth Since 2001
-
United States2 weeks ago
Ranked: The Largest U.S. Corporations by Number of Employees