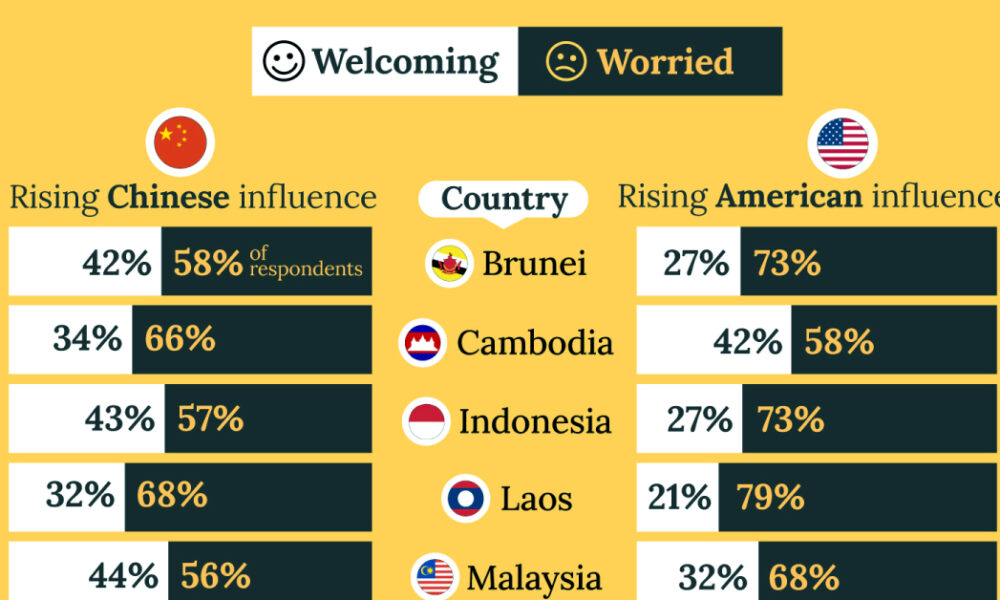
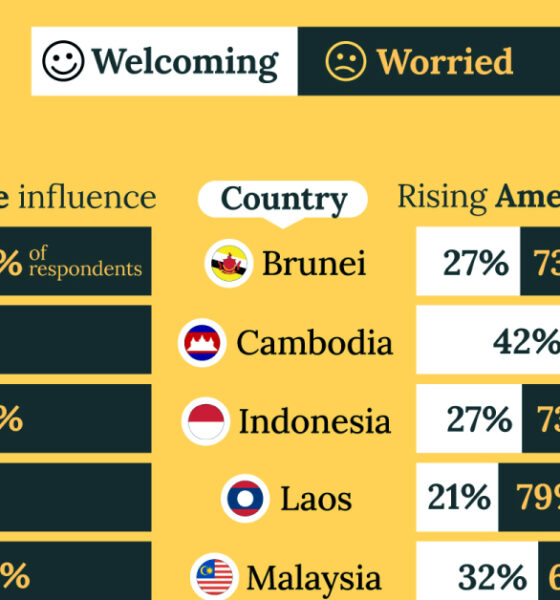
A significant share of respondents from an ASEAN-focused survey are not happy about rising American and Chinese influence in the...
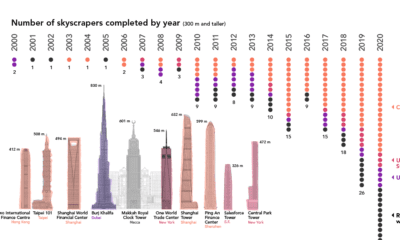

Once a rarity, supertall skyscrapers now punctuate the skylines of cities around the world. We chart the construction of these structures over the past 20 years
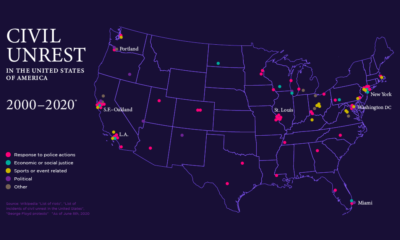

This map of civil unrest in the United States helps provide much needed context on how individual events fit within the nation-wide pattern over time.
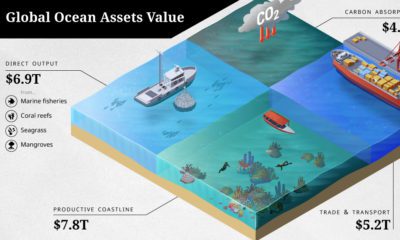

The ocean economy is under threat. How are human activities impacting the sustainable use of our ocean assets, valued at over $24 trillion?
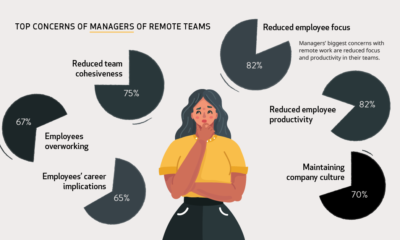

During the pandemic, millions of people have transitioned to working remotely. But how do workers and managers actually feel about it?
Our planet is in a constant state of creation and destruction as the plates of the earth collide. This visualization looks at earthquake magnitude.
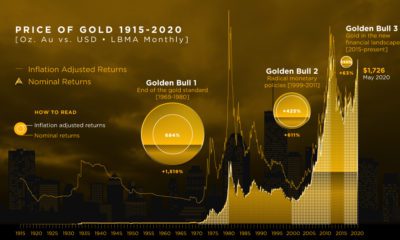

We break down gold's three major bull markets over the last century. This includes the current one, in which gold has hit 8-year highs.


Mass surveillance is becoming the status quo. This map dives into the countries where facial recognition technology is in place, and how it's used.
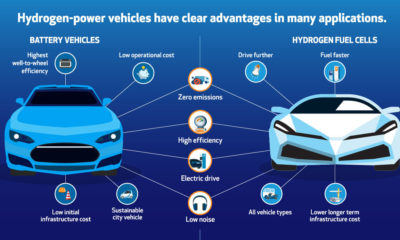

Here are six reasons why hydrogen and fuel cells can be a fit for helping with the transition to a lower-emission energy mix.
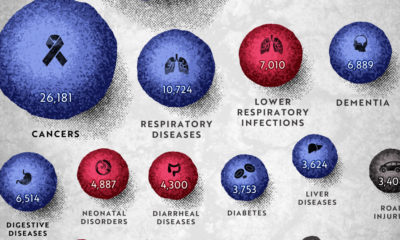

COVID-19 deaths can be hard to interpret without context. This graphic shows how many people die each day globally, by cause.
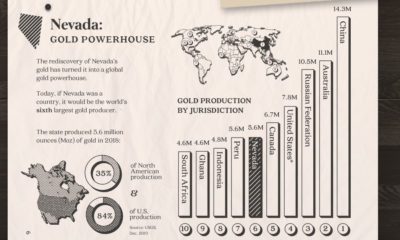

Nevada accounts for 84% of U.S. gold production today. Here's a look at the state's rich history, its prolific production, and what the future may hold.


