Energy
6 Ways Hydrogen and Fuel Cells Can Help Transition to Clean Energy
While fossil fuels offer an easily transportable, affordable, and energy-dense fuel for everyday use, the burning of this fuel creates pollutants, which can concentrate in city centers degrading the quality of air and life for residents.
The world is looking for alternative ways to ensure the mobility of people and goods with different power sources, and electric vehicles have high potential to fill this need.
But did you know that not all electric vehicles produce their electricity in the same way?
Hydrogen: An Alternative Vision for the EV
The world obsesses over battery technology and manufacturers such as Tesla, but there is an alternative fuel that powers rocket ships and is road-ready. Hydrogen is set to become an important fuel in the clean energy mix of the future.
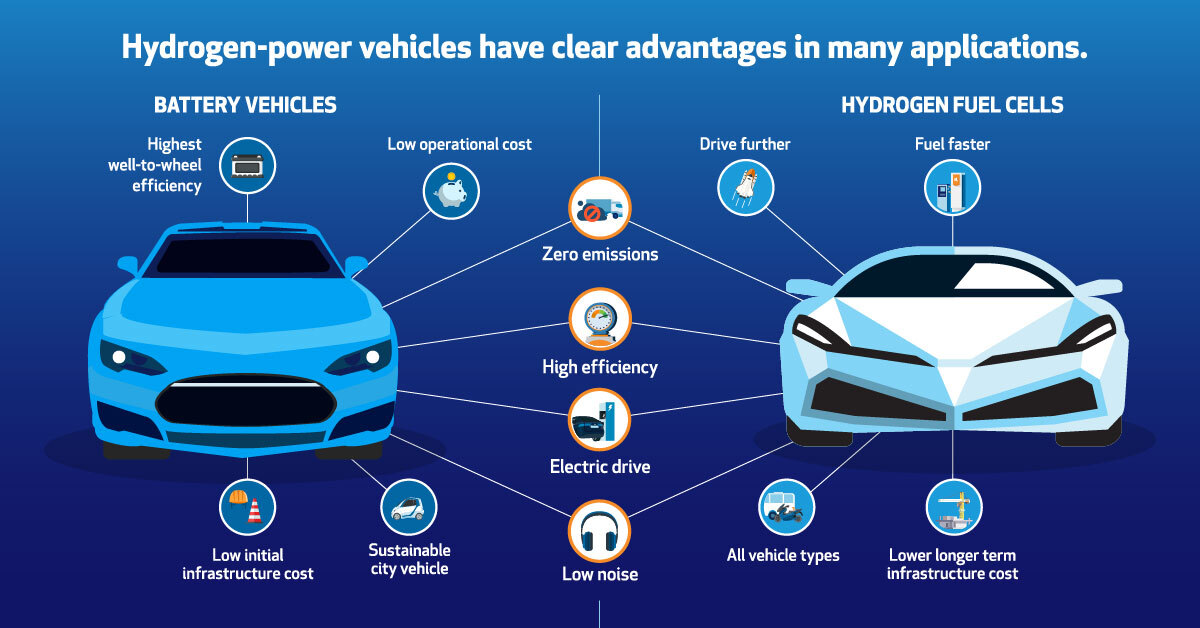
Today’s infographic comes from the Canadian Hydrogen and Fuel Cell Association (CHFCA) and it outlines the case for hydrogen.

Hydrogen Supply and Demand
Some scientists have made the argument that it was not hydrogen that caused the infamous Hindenburg to burst into flames. Instead, the powdered aluminum coating of the zeppelin, which provided its silver look, was the culprit. Essentially, the chemical compound coating the dirigibles was a crude form of rocket fuel.
Industry and business have safely used, stored, and transported hydrogen for 50 years, while hydrogen-powered electric vehicles have a proven safety record with over 10 million miles of operation. In fact, hydrogen has several properties that make it safer than fossil fuels:
- 14 times lighter than air and disperses quickly
- Flames have low radiant heat
- Less combustible
- Non-toxic
Since hydrogen is the most abundant chemical element in the universe, it can be produced almost anywhere with a variety of methods, including from fuels such as natural gas, oil, or coal, and through electrolysis. Fossil fuels can be treated with extreme temperatures to break their hydrocarbon bonds, releasing hydrogen as a byproduct. The latter method uses electricity to split water into hydrogen and oxygen.
Both methods produce hydrogen for storage, and later consumption in an electric fuel cell.
Fuel Cell or Battery?
Battery and hydrogen-powered vehicles have the same goal: to reduce the environmental impact from oil consumption. There are two ways to measure the environmental impact of vehicles, from “Well to Wheels” and from “Cradle to Grave”.
Well to wheels refers to the total emissions from the production of fuel to its use in everyday life. Meanwhile, cradle to grave includes the vehicle’s production, operation, and eventual destruction.
According to one study, both of these measurements show that hydrogen-powered fuel cells significantly reduce greenhouse gas emissions and air pollutants. For every kilometer a hydrogen-powered vehicle drives it produces only 2.7 grams per kilometer (g/km) of carbon dioxide while a battery electric vehicle produces 20 g/km.
During everyday use, both options offer zero emissions, high efficiency, an electric drive, and low noise, but hydrogen offers weight-saving advantages that battery-powered vehicles do not.
In one comparison, Toyota’s Mirai had a maximum driving range of 312 miles, 41% further than Tesla’s Model 3 220-mile range. The Mirai can refuel in minutes, while the Model 3 has to recharge in 8.5 hours for only a 45% charge at a specially configured quick charge station not widely available.
However, the world still lacks the significant infrastructure to make this hydrogen-fueled future possible.
Hydrogen Infrastructure
Large scale production delivers economic amounts of hydrogen. In order to achieve this scale, an extensive infrastructure of pipelines and fueling stations are required. However to build this, the world needs global coordination and action.
Countries around the world are laying the foundations for a hydrogen future. In 2017, CEOs from around the word formed the Hydrogen Council with the mission to accelerate the investment in hydrogen.
Globally, countries have announced plans to build 2,800 hydrogen refueling stations by 2025. German pipeline operators presented a plan to create a 1,200-kilometer grid by 2030 to transport hydrogen across the country, which would be the world’s largest in planning.
Fuel cell technology is road-ready with hydrogen infrastructure rapidly catching up. Hydrogen can deliver the power for a new clear energy era.


Energy
Charted: 4 Reasons Why Lithium Could Be the Next Gold Rush
Visual Capitalist has partnered with EnergyX to show why drops in prices and growing demand may make now the right time to invest in lithium.


4 Reasons Why You Should Invest in Lithium
Lithium’s importance in powering EVs makes it a linchpin of the clean energy transition and one of the world’s most precious minerals.
In this graphic, Visual Capitalist partnered with EnergyX to explore why now may be the time to invest in lithium.
1. Lithium Prices Have Dropped
One of the most critical aspects of evaluating an investment is ensuring that the asset’s value is higher than its price would indicate. Lithium is integral to powering EVs, and, prices have fallen fast over the last year:
| Date | LiOH·H₂O* | Li₂CO₃** |
|---|---|---|
| Feb 2023 | $76 | $71 |
| March 2023 | $71 | $61 |
| Apr 2023 | $43 | $33 |
| May 2023 | $43 | $33 |
| June 2023 | $47 | $45 |
| July 2023 | $44 | $40 |
| Aug 2023 | $35 | $35 |
| Sept 2023 | $28 | $27 |
| Oct 2023 | $24 | $23 |
| Nov 2023 | $21 | $21 |
| Dec 2023 | $17 | $16 |
| Jan 2024 | $14 | $15 |
| Feb 2024 | $13 | $14 |
Note: Monthly spot prices were taken as close to the 14th of each month as possible.
*Lithium hydroxide monohydrate MB-LI-0033
**Lithium carbonate MB-LI-0029
2. Lithium-Ion Battery Prices Are Also Falling
The drop in lithium prices is just one reason to invest in the metal. Increasing economies of scale, coupled with low commodity prices, have caused the cost of lithium-ion batteries to drop significantly as well.
In fact, BNEF reports that between 2013 and 2023, the price of a Li-ion battery dropped by 82%.
| Year | Price per KWh |
|---|---|
| 2023 | $139 |
| 2022 | $161 |
| 2021 | $150 |
| 2020 | $160 |
| 2019 | $183 |
| 2018 | $211 |
| 2017 | $258 |
| 2016 | $345 |
| 2015 | $448 |
| 2014 | $692 |
| 2013 | $780 |

3. EV Adoption is Sustainable
One of the best reasons to invest in lithium is that EVs, one of the main drivers behind the demand for lithium, have reached a price point similar to that of traditional vehicle.
According to the Kelly Blue Book, Tesla’s average transaction price dropped by 25% between 2022 and 2023, bringing it in line with many other major manufacturers and showing that EVs are a realistic transport option from a consumer price perspective.
| Manufacturer | September 2022 | September 2023 |
|---|---|---|
| BMW | $69,000 | $72,000 |
| Ford | $54,000 | $56,000 |
| Volkswagon | $54,000 | $56,000 |
| General Motors | $52,000 | $53,000 |
| Tesla | $68,000 | $51,000 |
4. Electricity Demand in Transport is Growing
As EVs become an accessible transport option, there’s an investment opportunity in lithium. But possibly the best reason to invest in lithium is that the IEA reports global demand for the electricity in transport could grow dramatically by 2030:
| Transport Type | 2022 | 2025 | 2030 |
|---|---|---|---|
| Buses 🚌 | 23,000 GWh | 50,000 GWh | 130,000 GWh |
| Cars 🚙 | 65,000 GWh | 200,000 GWh | 570,000 GWh |
| Trucks 🛻 | 4,000 GWh | 15,000 GWh | 94,000 GWh |
| Vans 🚐 | 6,000 GWh | 16,000 GWh | 72,000 GWh |
The Lithium Investment Opportunity
Lithium presents a potentially classic investment opportunity. Lithium and battery prices have dropped significantly, and recently, EVs have reached a price point similar to other vehicles. By 2030, the demand for clean energy, especially in transport, will grow dramatically.
With prices dropping and demand skyrocketing, now is the time to invest in lithium.
EnergyX is poised to exploit lithium demand with cutting-edge lithium extraction technology capable of extracting 300% more lithium than current processes.

-

 Lithium4 days ago
Ranked: The Top 10 EV Battery Manufacturers in 2023
Asia dominates this ranking of the world’s largest EV battery manufacturers in 2023.
-

 Energy1 week ago
The World’s Biggest Nuclear Energy Producers
China has grown its nuclear capacity over the last decade, now ranking second on the list of top nuclear energy producers.
-

 Energy1 month ago
The World’s Biggest Oil Producers in 2023
Just three countries accounted for 40% of global oil production last year.
-

 Energy1 month ago
How Much Does the U.S. Depend on Russian Uranium?
Currently, Russia is the largest foreign supplier of nuclear power fuel to the U.S.
-

 Uranium2 months ago
Charted: Global Uranium Reserves, by Country
We visualize the distribution of the world’s uranium reserves by country, with 3 countries accounting for more than half of total reserves.
-

 Energy3 months ago
Visualizing the Rise of the U.S. as Top Crude Oil Producer
Over the last decade, the United States has established itself as the world’s top producer of crude oil, surpassing Saudi Arabia and Russia.

-

 Education1 week ago
How Hard Is It to Get Into an Ivy League School?
-

 Technology2 weeks ago
Ranked: Semiconductor Companies by Industry Revenue Share
-

 Markets2 weeks ago
Ranked: The World’s Top Flight Routes, by Revenue
-

 Demographics2 weeks ago
Population Projections: The World’s 6 Largest Countries in 2075
-

 Markets2 weeks ago
The Top 10 States by Real GDP Growth in 2023
-

 Demographics2 weeks ago
The Smallest Gender Wage Gaps in OECD Countries
-

 Economy2 weeks ago
Where U.S. Inflation Hit the Hardest in March 2024
-

 Green2 weeks ago
Top Countries By Forest Growth Since 2001