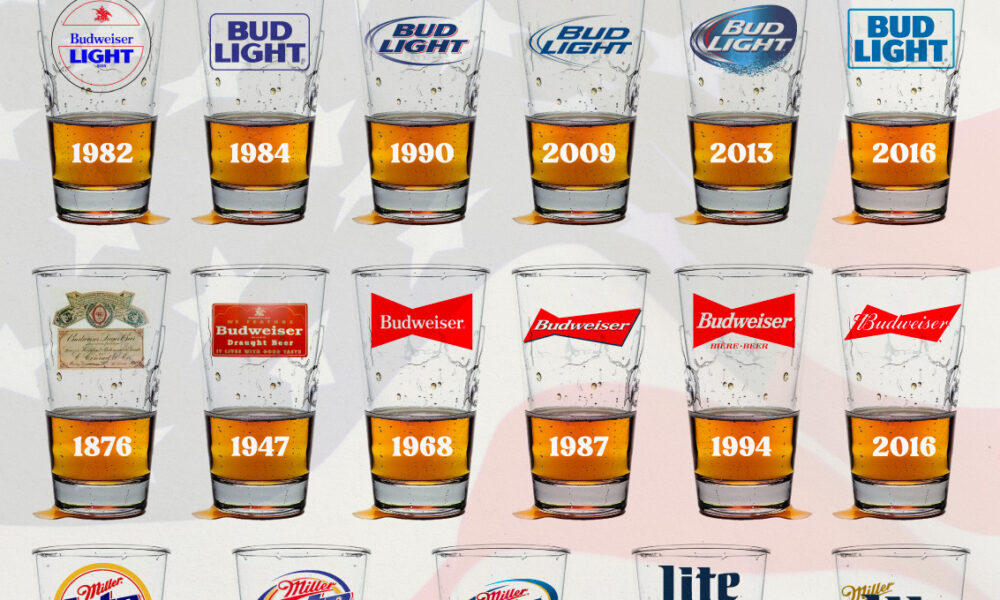
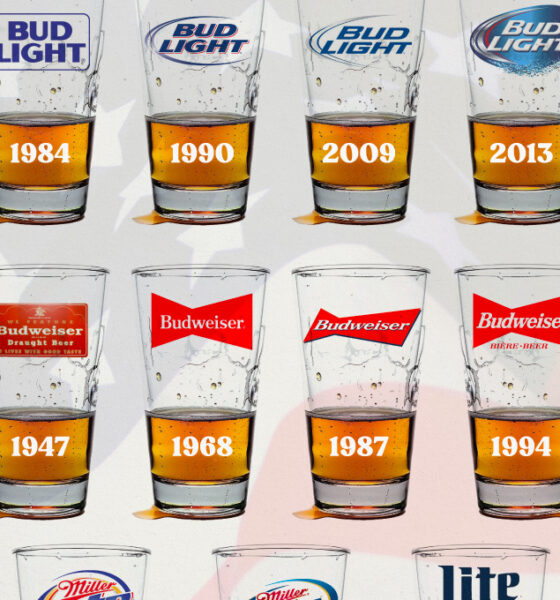
In this graphic, we analyze the evolution of popular U.S. beer logos like Budweiser, Coors Light, Bud Light, and more.
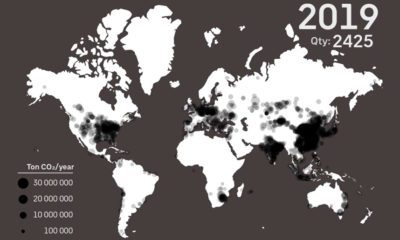

See every major coal power plant ever commissioned on this animation, which covers a time period from 1927 until 2019.
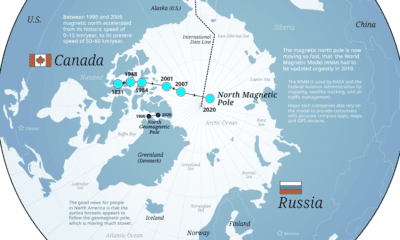

Is someone stealing Christmas? It isn't the Grinch or Putin stealing Santa’s workshop, but Earth's natural processes that are moving the North Pole.
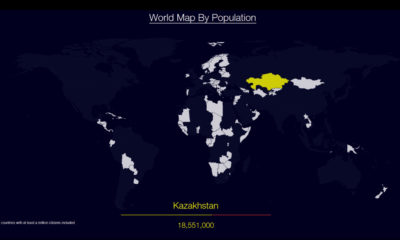

Watch countries appear one-by-one to form a cohesive world map, when they are ordered by population.
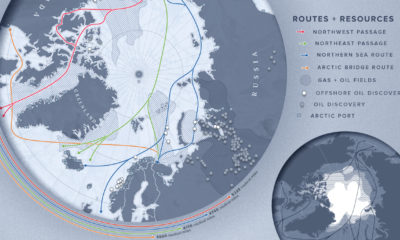

As the Arctic becomes more accessible due to reduced ice cover, countries with polar real estate increasingly viewing the region through an economic lens.


This infographic delves into what it takes to become an effective leader, and how those qualities can impact a company—beyond employee satisfaction.
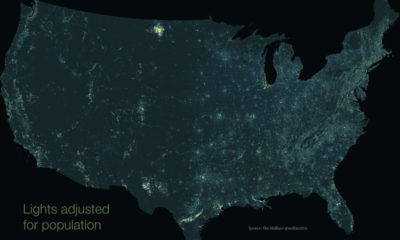

This unique map subtracts population from nighttime light output, giving us a unique perspective into America's rural light pollution hot spots.
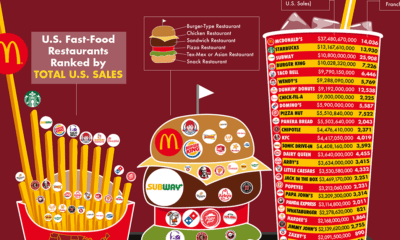

Every year, fast food chains rake in north of $200 billion in revenue per year. Here are the biggest chains, ranked by revenue and number of...
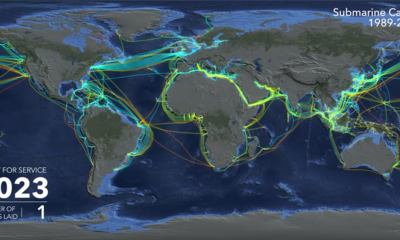

Watch the explosive growth of the global submarine cable network, and learn who's funding the next generation of cables.
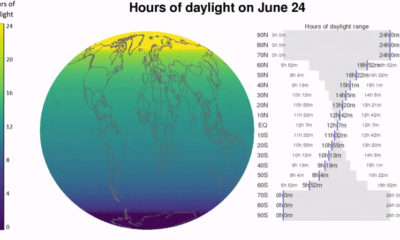

The length of your days can change depending on the seasons, and where you are on Earth. Watch how these patterns unfold over a year.
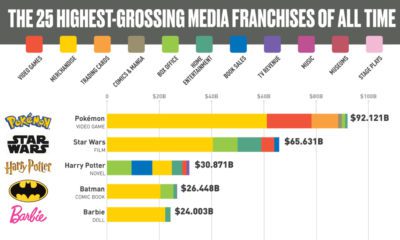

This infographic ranks the most successful media franchises of all time, and explores how they innovate to stay relevant.


