

Lions, tigers, and bears, oh my!—these animals do not feature on this list of popular American household pets.


The Dow Jones Industrial Average is constantly evolving. This chart tracks which companies have come and gone since the inception of the index in 1928.
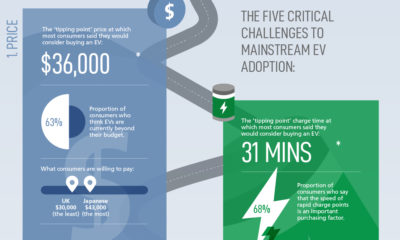

The pace of mainstream EV adoption has been slow, but is expected to accelerate as automakers overcome these five critical challenges.


What’s America been craving? Here’s a look at the top 50 most popular fast food chains, ranked by U.S. sales in 2019.
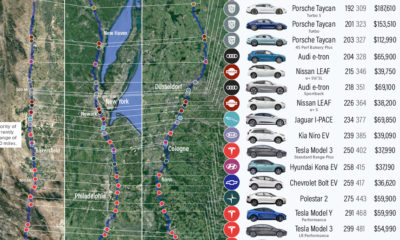

We visualize how far popular EV models will take you on real-world routes between major cities, and which are the most cost effective.
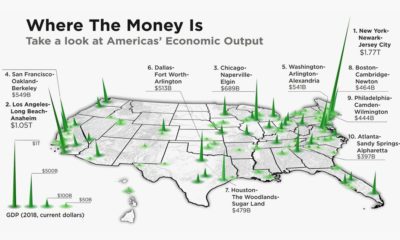

The total U.S. GDP stands at a whopping $21 trillion, but which metro areas contribute to the most in terms of economic output?


This graphic looks at 29 different psychological tricks that marketers use to try and influence consumer behavior.
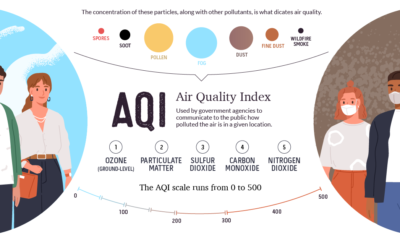

This graphic breaks down how the air quality index is measured, and looks at which regions are hardest hit by atmospheric pollution and wildfires.


A lot can happen in an internet minute. This graphic looks at the enormous numbers behind the online services billions use every day.
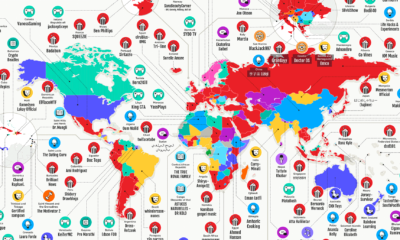

This interesting graphic gives an overview of the world’s most popular—and the highest paid—YouTubers in 187 different countries.
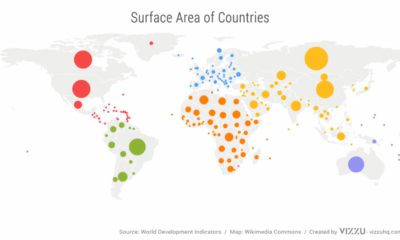

We’ve come a long way since Pangea. This short video examines the area, population, and GDP of our continents as a share of the world's total.


