Misc
Charting the Last 20 Years of Supertall Skyscrapers
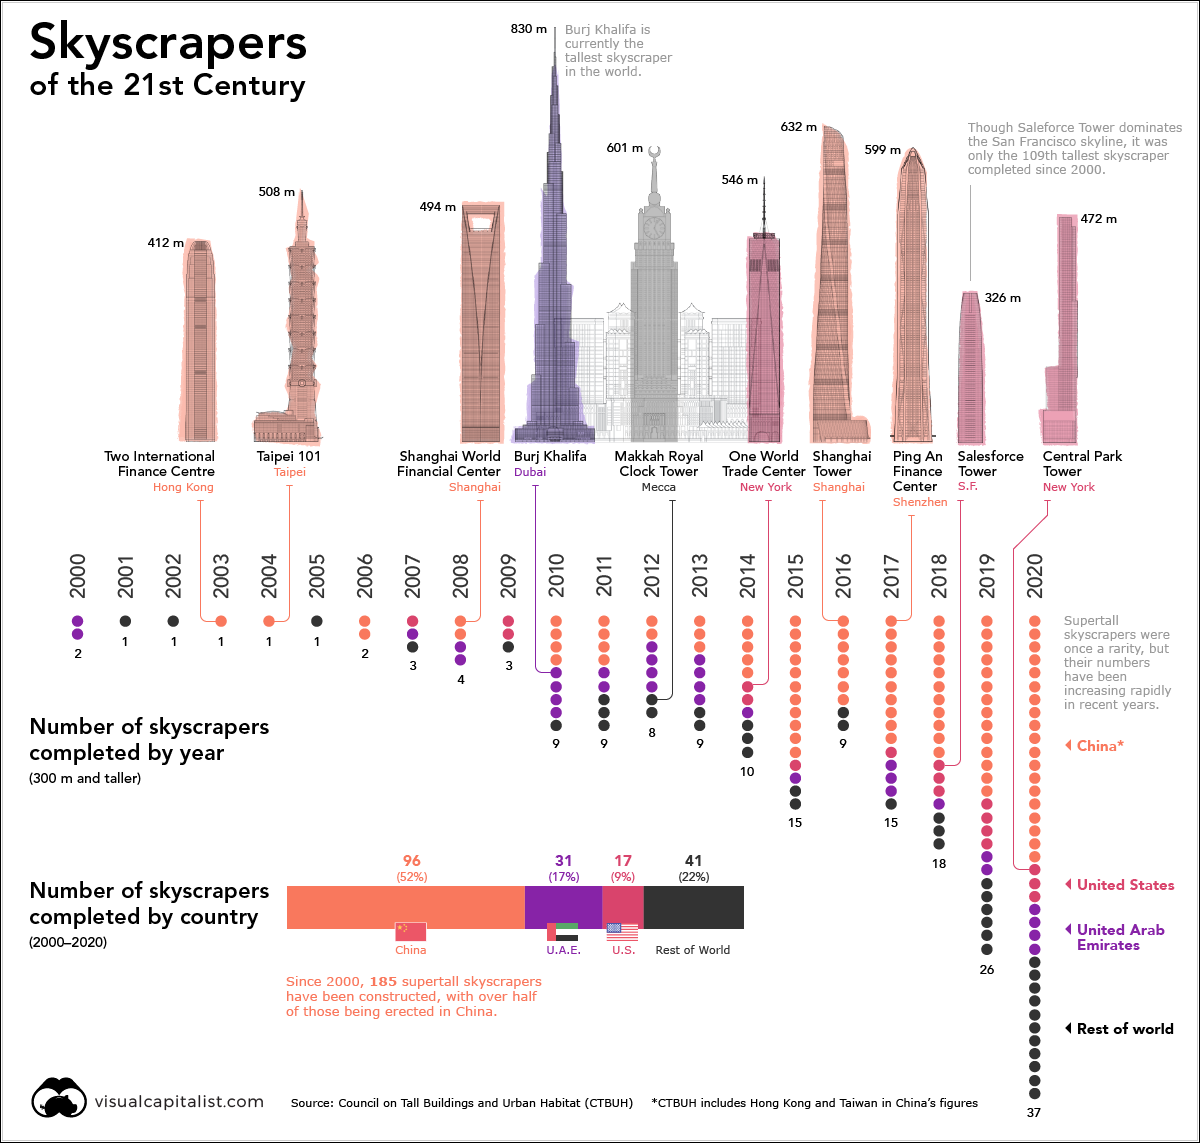
Charting the Last 20 Years of Supertall Skyscrapers
At the end of the 20th century, supertall skyscrapers—buildings exceeding 300 meters in height—were still somewhat of a novelty in the world.
Only 24 supertall skyscrapers existed at that time, with half of them located in U.S. cities. That list included iconic structures such as the Empire State Building and Willis Tower, as well as newer landmarks like Atlanta’s Bank of America Plaza.
According to the Council on Tall Buildings and Urban Habitat (CTBUH) database, the following buildings comprised the world’s full roster of supertall skyscrapers in 1999:
| Building Name | City | Height (m) | Height (ft) | Completion |
|---|---|---|---|---|
| One World Trade Center | New York City 🇺🇸 | 417 | 1,368 | 1972 |
| Two World Trade Center | New York City 🇺🇸 | 415 | 1,362 | 1973 |
| Petronas Twin Tower 1 | Kuala Lumpur 🇲🇾 | 452 | 1,483 | 1998 |
| Petronas Twin Tower 2 | Kuala Lumpur 🇲🇾 | 452 | 1,483 | 1998 |
| Willis Tower | Chicago 🇺🇸 | 442 | 1,451 | 1974 |
| Jin Mao Tower | Shanghai 🇨🇳 | 421 | 1,380 | 1999 |
| CITIC Plaza | Guangzhou 🇨🇳 | 390 | 1,280 | 1996 |
| Shun Hing Square | Shenzhen 🇨🇳 | 384 | 1,260 | 1996 |
| Empire State Building | New York City 🇺🇸 | 381 | 1,250 | 1931 |
| Central Plaza | Hong Kong 🇭🇰 | 374 | 1,227 | 1992 |
| Bank of China Tower | Hong Kong 🇭🇰 | 367 | 1,205 | 1990 |
| 85 Sky Tower | Kaohsiung 🇨🇳 | 348 | 1,140 | 1997 |
| Aon Center | Chicago 🇺🇸 | 346 | 1,136 | 1973 |
| The Center | Hong Kong 🇭🇰 | 346 | 1,135 | 1998 |
| 875 North Michigan Avenue | Chicago 🇺🇸 | 344 | 1,128 | 1969 |
| Burj Al Arab | Dubai 🇦🇪 | 321 | 1,053 | 1999 |
| Chrysler Building | New York City 🇺🇸 | 319 | 1,046 | 1930 |
| Bank of America Plaza | Atlanta 🇺🇸 | 312 | 1,023 | 1992 |
| U.S. Bank Tower | Los Angeles 🇺🇸 | 310 | 1,018 | 1990 |
| The Franklin - North Tower | Chicago 🇺🇸 | 307 | 1,007 | 1989 |
| JPMorgan Chase Tower | Houston 🇺🇸 | 305 | 1,002 | 1982 |
| Baiyoke Tower II | Bangkok 🇹🇭 | 304 | 997 | 1997 |
| Two Prudential Plaza | Chicago 🇺🇸 | 303 | 995 | 1990 |
| Wells Fargo Plaza | Houston 🇺🇸 | 302 | 992 | 1983 |
With the exception of the original World Trade Center towers in New York, all these iconic structures are still standing. Of course, there is now a much bigger cohort of skyscrapers sharing the skyline with them today.
20 Years of Supertall Skyscraper Construction
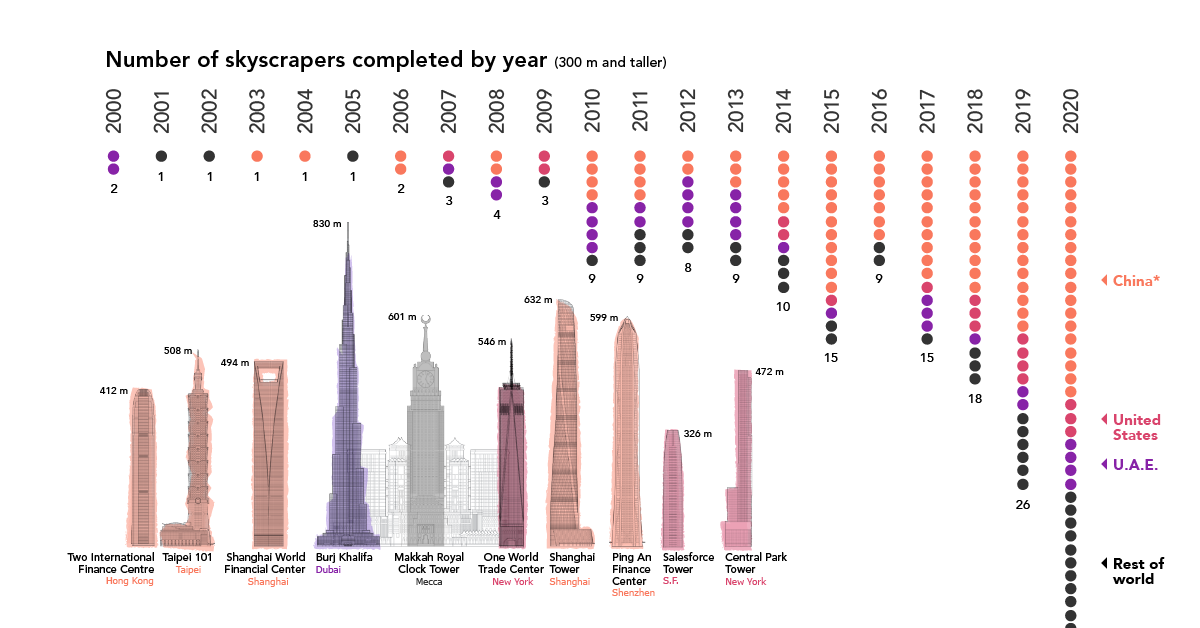
In the 21st century, at least one supertall skyscraper has been completed every year. In 2019 alone, the world built more of these incredible structures than the total that existed in 1999.
Here are the 20 tallest skyscrapers completed in the past 20 years:
| Building Name | City | Height (m) | Height (ft) | Completion |
|---|---|---|---|---|
| Burj Khalifa | Dubai 🇦🇪 | 828 | 2,717 | 2010 |
| Shanghai Tower | Shanghai 🇨🇳 | 632 | 2,073 | 2015 |
| Makkah Royal Clock Tower | Mecca 🇸🇦 | 601 | 1,972 | 2012 |
| Ping An Finance Center | Shenzhen 🇨🇳 | 599 | 1,965 | 2017 |
| Lotte World Tower | Seoul 🇰🇷 | 555 | 1,819 | 2017 |
| One World Trade Center | New York City 🇺🇸 | 541 | 1,776 | 2014 |
| Guangzhou CTF Finance Centre | Guangzhou 🇨🇳 | 530 | 1,739 | 2016 |
| Tianjin CTF Finance Centre | Tianjin 🇨🇳 | 530 | 1,739 | 2019 |
| CITIC Tower | Beijing 🇨🇳 | 528 | 1,731 | 2018 |
| TAIPEI 101 | Taipei 🇹🇼 | 508 | 1,667 | 2004 |
| Shanghai World Financial Center | Shanghai 🇨🇳 | 492 | 1,614 | 2008 |
| International Commerce Centre | Hong Kong 🇭🇰 | 484 | 1,588 | 2010 |
| Lakhta Center | St. Petersburg 🇷🇺 | 462 | 1,516 | 2019 |
| Vincom Landmark 81 | Ho Chi Minh City 🇻🇳 | 461 | 1,513 | 2018 |
| Changsha IFS Tower T1 | Changsha 🇨🇳 | 452 | 1,483 | 2018 |
| Suzhou IFS | Suzhou 🇨🇳 | 450 | 1,476 | 2019 |
| Zifeng Tower | Nanjing 🇨🇳 | 450 | 1,476 | 2010 |
| The Exchange 106 | Kuala Lumpur 🇲🇾 | 445 | 1,460 | 2019 |
| KK100 | Shenzhen 🇨🇳 | 442 | 1,449 | 2011 |
| Guangzhou International Finance Center | Guangzhou 🇨🇳 | 439 | 1,439 | 2010 |
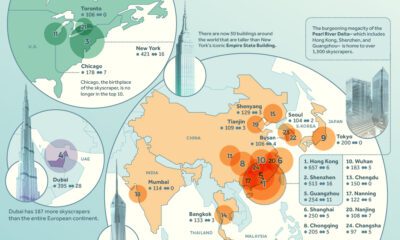
With activity that reflects the country’s meteoric economic rise, China is an obvious point of focus in the skyscraper conversation. The world’s most populous nation been on a remarkable building tear in recent years, with activity spread throughout the country. No fewer than 30 Chinese cities added supertall skyscrapers to their skylines in the past two decades.
Vertical construction in the United States has been primarily focused in one of the original skyscraper hubs, New York City. In the long, storied history of skyscraper construction in New York City, it’s interesting to note that 8 of its 10 tallest buildings were built in the past 15 years.
Of course, no conversation about skyscrapers is complete without mentioning Dubai. No city on Earth can match the sheer magnitude of supertall skyscraper construction there—a remarkable feat considering the UAE’s size compared to the other two leaders, China and the United States. Over that past 20 years, Dubai added 23 supertall skyscrapers to its skyline, including four that are taller than the Empire State Building. Remarkably, there are another ten buildings under construction today that surpass the 300 meter mark.
What the Future Holds
The process from conceiving to completing supertall skyscrapers can take many years—especially as these ambitious structures reach higher into the sky. For example, the Ping An Finance Center in Shenzhen was first proposed in 2008, but not completed until 2017.
This multi-year process means that the pipeline of upcoming skyscrapers is very predictable. According to CTBUH, there are currently 132 supertall skyscrapers in various phases of construction around the world right now. That’s more than five times the number of existing supertall structures that existed at the dawn of the new millennium. This includes the Jeddah Tower in Saudi Arabia, which will be the first skyscraper to hit the one kilometer mark – shattering the record height set by the Burj Khalifa.
Over the next 20 years, as economic fortunes shift and architectural innovations advance, it remains to be seen what heights future skyscrapers will reach.


VC+
VC+: Get Our Key Takeaways From the IMF’s World Economic Outlook
A sneak preview of the exclusive VC+ Special Dispatch—your shortcut to understanding IMF’s World Economic Outlook report.

Have you read IMF’s latest World Economic Outlook yet? At a daunting 202 pages, we don’t blame you if it’s still on your to-do list.
But don’t worry, you don’t need to read the whole April release, because we’ve already done the hard work for you.
To save you time and effort, the Visual Capitalist team has compiled a visual analysis of everything you need to know from the report—and our VC+ Special Dispatch is available exclusively to VC+ members. All you need to do is log into the VC+ Archive.
If you’re not already subscribed to VC+, make sure you sign up now to access the full analysis of the IMF report, and more (we release similar deep dives every week).
For now, here’s what VC+ members get to see.
Your Shortcut to Understanding IMF’s World Economic Outlook
With long and short-term growth prospects declining for many countries around the world, this Special Dispatch offers a visual analysis of the key figures and takeaways from the IMF’s report including:
- The global decline in economic growth forecasts
- Real GDP growth and inflation forecasts for major nations in 2024
- When interest rate cuts will happen and interest rate forecasts
- How debt-to-GDP ratios have changed since 2000
- And much more!

Get the Full Breakdown in the Next VC+ Special Dispatch
VC+ members can access the full Special Dispatch by logging into the VC+ Archive, where you can also check out previous releases.
Make sure you join VC+ now to see exclusive charts and the full analysis of key takeaways from IMF’s World Economic Outlook.
Don’t miss out. Become a VC+ member today.
What You Get When You Become a VC+ Member
VC+ is Visual Capitalist’s premium subscription. As a member, you’ll get the following:
- Special Dispatches: Deep dive visual briefings on crucial reports and global trends
- Markets This Month: A snappy summary of the state of the markets and what to look out for
- The Trendline: Weekly curation of the best visualizations from across the globe
- Global Forecast Series: Our flagship annual report that covers everything you need to know related to the economy, markets, geopolitics, and the latest tech trends
- VC+ Archive: Hundreds of previously released VC+ briefings and reports that you’ve been missing out on, all in one dedicated hub
You can get all of the above, and more, by joining VC+ today.

-

 Education1 week ago
How Hard Is It to Get Into an Ivy League School?
-

 Technology2 weeks ago
Ranked: Semiconductor Companies by Industry Revenue Share
-

 Markets2 weeks ago
Ranked: The World’s Top Flight Routes, by Revenue
-

 Demographics2 weeks ago
Population Projections: The World’s 6 Largest Countries in 2075
-

 Markets2 weeks ago
The Top 10 States by Real GDP Growth in 2023
-

 Demographics2 weeks ago
The Smallest Gender Wage Gaps in OECD Countries
-

 Economy2 weeks ago
Where U.S. Inflation Hit the Hardest in March 2024
-

 Green2 weeks ago
Top Countries By Forest Growth Since 2001