Wealth
Who are the Dividend Aristocrats in 2021?


The Dividend Aristocrats in 2021
Legendary investor George Soros once said, “Good investing should be boring”. But an increase in volatile themes today suggests this maxim has gone ignored by at least some market participants.
From a high level, we can view investments on a spectrum. Volatile assets like cryptocurrencies and SPACs are more on the exciting side of things. The boring side is likely where Dividend Aristocrat stocks lie.
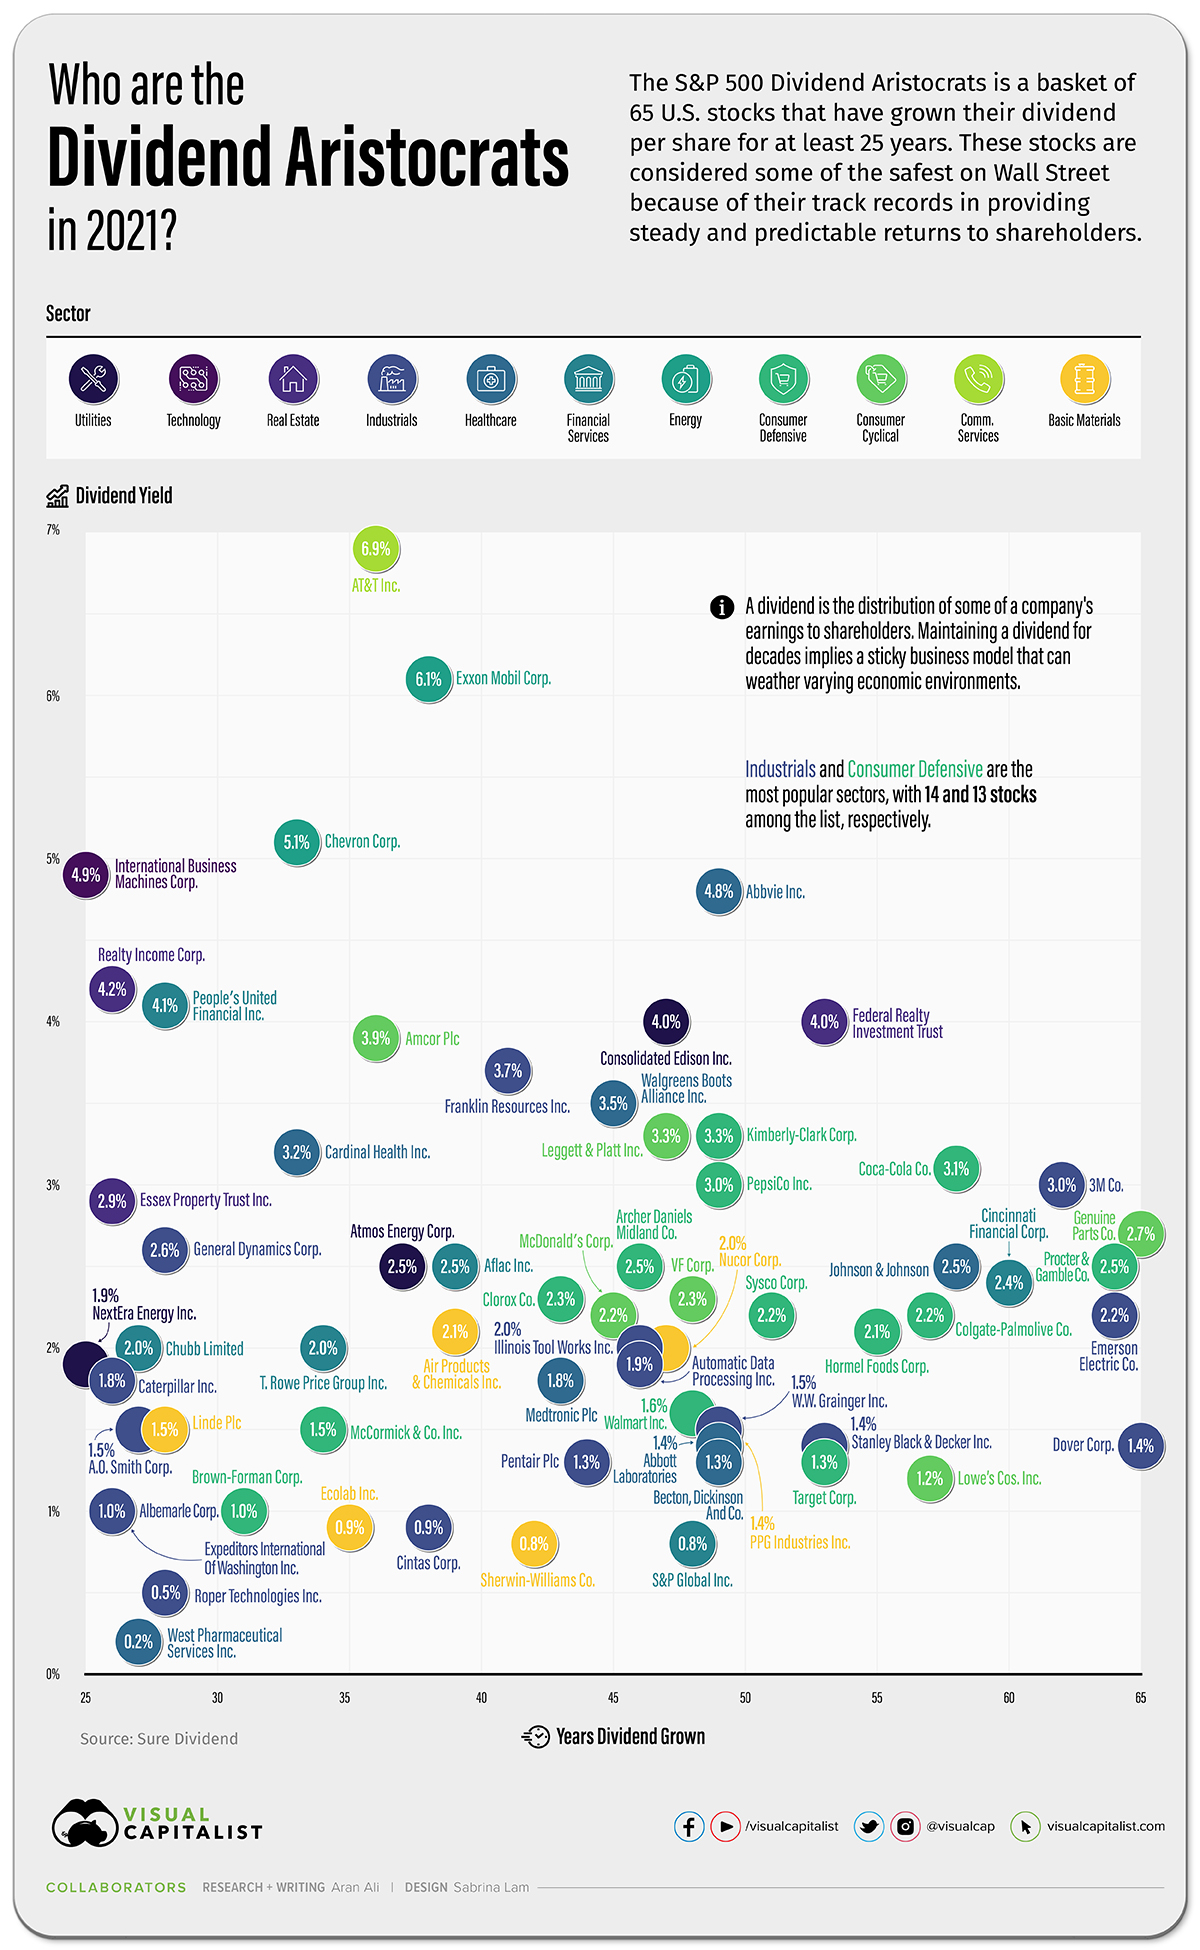
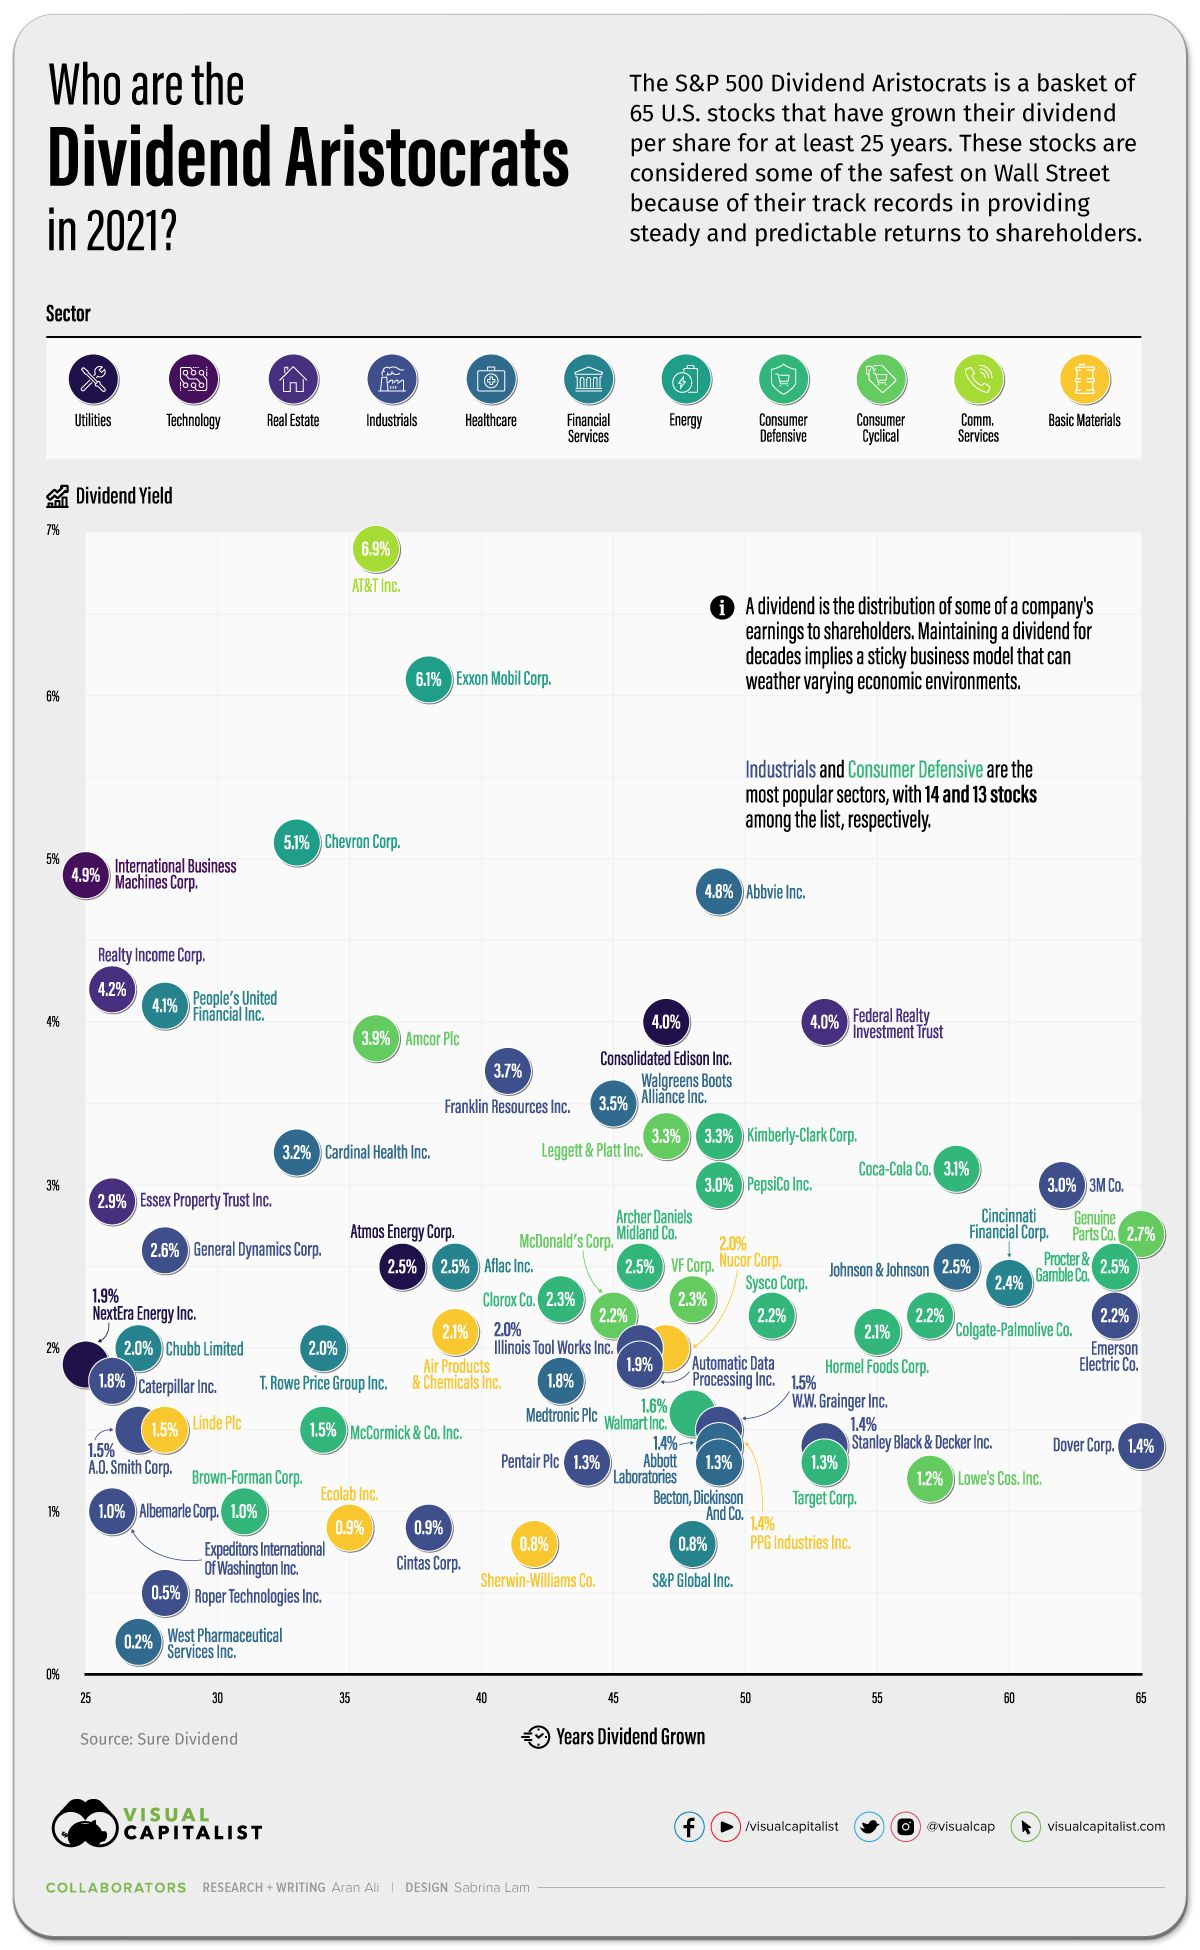
The data above, from Sure Dividend, looks at all 65 Dividend Aristocrats, ranking them by their yield, sector, and years of growth.
What are Dividend Aristocrats?
The U.S. Dividend Aristocrats are a basket of 65 stocks in the S&P 500 index. These companies have been growing their dividend per share consecutively, for a minimum of 25 years.
This is easier said than done, since companies often distribute dividends quarterly. To pay and grow a dividend in the long run implies a business model that can withstand varying economic environments, including setbacks like market crashes.
Though dividend stocks may not carry the same excitement as other investments, studies show that dividends represent over 50% of total S&P 500 market returns.
| Company | Dividend Yield | Years Dividend Grown | Sector |
|---|---|---|---|
| AT&T, Inc. | 6.9% | 36 | Communication Services |
| Exxon Mobil Corp. | 6.1% | 38 | Energy |
| Chevron Corp. | 5.1% | 33 | Energy |
| International Business Machines Corp. | 4.9% | 25 | Technology |
| Abbvie Inc | 4.8% | 49 | Healthcare |
| Realty Income Corp. | 4.2% | 26 | Real Estate |
| People`s United Financial Inc | 4.1% | 28 | Financial Services |
| Federal Realty Investment Trust | 4.0% | 53 | Real Estate |
| Consolidated Edison, Inc. | 4.0% | 47 | Utilities |
| Amcor Plc | 3.9% | 36 | Consumer Cyclical |
| Franklin Resources, Inc. | 3.7% | 41 | Financial Services |
| Walgreens Boots Alliance Inc | 3.5% | 45 | Healthcare |
| Leggett & Platt, Inc. | 3.3% | 47 | Consumer Cyclical |
| Kimberly-Clark Corp. | 3.3% | 49 | Consumer Defensive |
| Cardinal Health, Inc. | 3.2% | 33 | Healthcare |
| Coca-Cola Co | 3.1% | 58 | Consumer Defensive |
| PepsiCo Inc | 3.0% | 49 | Consumer Defensive |
| 3M Co. | 3.0% | 62 | Industrials |
| Essex Property Trust, Inc. | 2.9% | 26 | Real Estate |
| Genuine Parts Co. | 2.7% | 65 | Consumer Cyclical |
| General Dynamics Corp. | 2.6% | 28 | Industrials |
| Procter & Gamble Co. | 2.5% | 64 | Consumer Defensive |
| Johnson & Johnson | 2.5% | 58 | Healthcare |
| Archer Daniels Midland Co. | 2.5% | 46 | Consumer Defensive |
| Aflac Inc. | 2.5% | 39 | Financial Services |
| Atmos Energy Corp. | 2.5% | 37 | Utilities |
| Cincinnati Financial Corp. | 2.4% | 60 | Financial Services |
| Clorox Co. | 2.3% | 43 | Consumer Defensive |
| VF Corp. | 2.3% | 48 | Consumer Cyclical |
| Sysco Corp. | 2.2% | 51 | Consumer Defensive |
| Colgate-Palmolive Co. | 2.2% | 57 | Consumer Defensive |
| McDonald`s Corp | 2.2% | 45 | Consumer Cyclical |
| Emerson Electric Co. | 2.2% | 64 | Industrials |
| Hormel Foods Corp. | 2.1% | 55 | Consumer Defensive |
| Air Products & Chemicals Inc. | 2.1% | 39 | Basic Materials |
| Nucor Corp. | 2.0% | 47 | Basic Materials |
| Illinois Tool Works, Inc. | 2.0% | 46 | Industrials |
| T. Rowe Price Group Inc. | 2.0% | 34 | Financial Services |
| Chubb Limited | 2.0% | 27 | Financial Services |
| Automatic Data Processing Inc. | 1.9% | 46 | Industrials |
| NextEra Energy Inc | 1.9% | 25 | Utilities |
| Medtronic Plc | 1.8% | 43 | Healthcare |
| Caterpillar Inc. | 1.8% | 26 | Industrials |
| Walmart Inc | 1.6% | 48 | Consumer Defensive |
| McCormick & Co., Inc. | 1.5% | 34 | Consumer Defensive |
| A.O. Smith Corp. | 1.5% | 27 | Industrials |
| W.W. Grainger Inc. | 1.5% | 49 | Industrials |
| Linde Plc | 1.5% | 28 | Basic Materials |
| Abbott Laboratories | 1.4% | 49 | Healthcare |
| Dover Corp. | 1.4% | 65 | Industrials |
| Stanley Black & Decker Inc | 1.4% | 53 | Industrials |
| Target Corp | 1.3% | 53 | Consumer Defensive |
| PPG Industries, Inc. | 1.3% | 49 | Basic Materials |
| Becton, Dickinson And Co. | 1.3% | 49 | Healthcare |
| Pentair plc | 1.3% | 44 | Industrials |
| Lowe`s Cos., Inc. | 1.2% | 57 | Consumer Cyclical |
| Albemarle Corp. | 1.0% | 26 | Basic Materials |
| Brown-Forman Corp. | 1.0% | 31 | Consumer Defensive |
| Expeditors International Of Washington, Inc. | 1.0% | 26 | Industrials |
| Ecolab, Inc. | 0.9% | 35 | Basic Materials |
| Cintas Corporation | 0.9% | 38 | Industrials |
| Sherwin-Williams Co. | 0.8% | 42 | Basic Materials |
| S&P Global Inc | 0.8% | 48 | Financial Services |
| Roper Technologies Inc | 0.5% | 28 | Industrials |
| West Pharmaceutical Services, Inc. | 0.2% | 27 | Healthcare |
Numerous companies on this list have brand value that stretches all over the globe—including the likes of McDonald’s, Coca-Cola, and Walmart.
Vast global recognition and branding power is in part why these companies can generate cash flows to pay dividends for decades on end. For instance, 94% of the world population recognizes Coca-Cola’s logo.
Zooming In
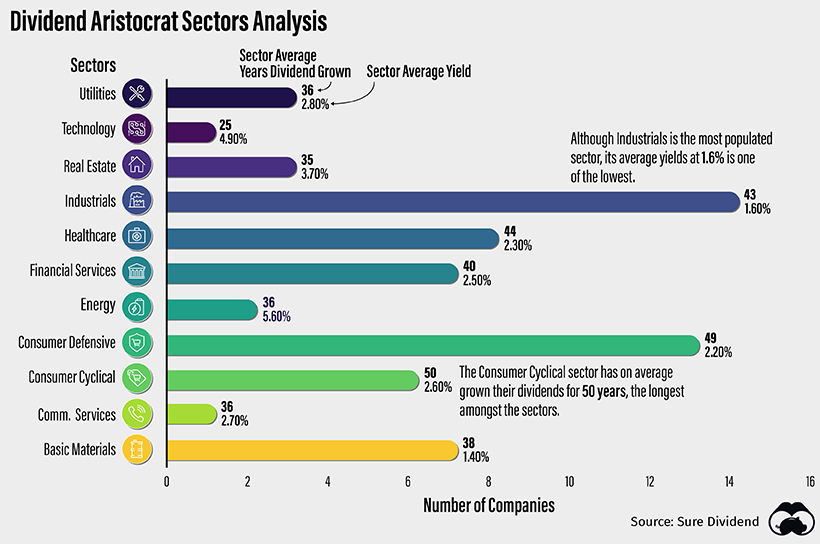
The 65 Dividend Aristocrat stocks break down into 11 sectors. Across sectors, Industrials is the most crowded, consisting of 14 companies, with an average yield of 1.6% and a dividend growth duration of 43 years. Popular stocks in this sector include 3M and Caterpillar.
Next is the Consumer Defensive sector, containing 13 companies like Clorox, Target, Pepsi, and Procter & Gamble. The average yield is 2.2%, with an average growing duration of 49 years.
The highest yield by sector belongs to Energy, at 5.5%, but is only made up of only Chevron and Exxon Mobil. Their dividend track record may falter in the years to come, due to transitions away from the oil business. Just last year, Big Oil firms reported record net income losses, and Exxon was booted from the Dow Jones Industrial Average (DJIA).
The Consumer Cyclical sector has been increasing their dividend for an average of 50 years, the longest of any sector. Lowe’s and McDonald’s are involved in this category.
Businesses for Today and Tomorrow
Although the Dividend Aristocrats list is published every year, the companies on the list are a stable bunch, meaning changes are fairly infrequent.
In a market climate in part shaped by low rates and compressed yields in the fixed income space, Dividend Aristocrats might be a particularly attractive alternative for investors with a longer-term outlook.


Money
Charted: Which City Has the Most Billionaires in 2024?
Just two countries account for half of the top 20 cities with the most billionaires. And the majority of the other half are found in Asia.


Charted: Which Country Has the Most Billionaires in 2024?
This was originally posted on our Voronoi app. Download the app for free on iOS or Android and discover incredible data-driven charts from a variety of trusted sources.
Some cities seem to attract the rich. Take New York City for example, which has 340,000 high-net-worth residents with investable assets of more than $1 million.
But there’s a vast difference between being a millionaire and a billionaire. So where do the richest of them all live?
Using data from the Hurun Global Rich List 2024, we rank the top 20 cities with the highest number of billionaires in 2024.
A caveat to these rich lists: sources often vary on figures and exact rankings. For example, in last year’s reports, Forbes had New York as the city with the most billionaires, while the Hurun Global Rich List placed Beijing at the top spot.
Ranked: Top 20 Cities with the Most Billionaires in 2024
The Chinese economy’s doldrums over the course of the past year have affected its ultra-wealthy residents in key cities.
Beijing, the city with the most billionaires in 2023, has not only ceded its spot to New York, but has dropped to #4, overtaken by London and Mumbai.
| Rank | City | Billionaires | Rank Change YoY |
|---|---|---|---|
| 1 | 🇺🇸 New York | 119 | +1 |
| 2 | 🇬🇧 London | 97 | +3 |
| 3 | 🇮🇳 Mumbai | 92 | +4 |
| 4 | 🇨🇳 Beijing | 91 | -3 |
| 5 | 🇨🇳 Shanghai | 87 | -2 |
| 6 | 🇨🇳 Shenzhen | 84 | -2 |
| 7 | 🇭🇰 Hong Kong | 65 | -1 |
| 8 | 🇷🇺 Moscow | 59 | No Change |
| 9 | 🇮🇳 New Delhi | 57 | +6 |
| 10 | 🇺🇸 San Francisco | 52 | No Change |
| 11 | 🇹🇭 Bangkok | 49 | +2 |
| 12 | 🇹🇼 Taipei | 45 | +2 |
| 13 | 🇫🇷 Paris | 44 | -2 |
| 14 | 🇨🇳 Hangzhou | 43 | -5 |
| 15 | 🇸🇬 Singapore | 42 | New to Top 20 |
| 16 | 🇨🇳 Guangzhou | 39 | -4 |
| 17T | 🇮🇩 Jakarta | 37 | +1 |
| 17T | 🇧🇷 Sao Paulo | 37 | No Change |
| 19T | 🇺🇸 Los Angeles | 31 | No Change |
| 19T | 🇰🇷 Seoul | 31 | -3 |
In fact all Chinese cities on the top 20 list have lost billionaires between 2023–24. Consequently, they’ve all lost ranking spots as well, with Hangzhou seeing the biggest slide (-5) in the top 20.
Where China lost, all other Asian cities—except Seoul—in the top 20 have gained ranks. Indian cities lead the way, with New Delhi (+6) and Mumbai (+3) having climbed the most.
At a country level, China and the U.S combine to make up half of the cities in the top 20. They are also home to about half of the world’s 3,200 billionaire population.
In other news of note: Hurun officially counts Taylor Swift as a billionaire, estimating her net worth at $1.2 billion.

-

 Debt1 week ago
How Debt-to-GDP Ratios Have Changed Since 2000
-

 Markets2 weeks ago
Ranked: The World’s Top Flight Routes, by Revenue
-

 Demographics2 weeks ago
Population Projections: The World’s 6 Largest Countries in 2075
-

 Markets2 weeks ago
The Top 10 States by Real GDP Growth in 2023
-

 Demographics2 weeks ago
The Smallest Gender Wage Gaps in OECD Countries
-

 Economy2 weeks ago
Where U.S. Inflation Hit the Hardest in March 2024
-

 Green2 weeks ago
Top Countries By Forest Growth Since 2001
-

 United States2 weeks ago
Ranked: The Largest U.S. Corporations by Number of Employees