Markets
Mapped: The World’s Top 10 Cities in 2035
Mapped: Where Will The Top 10 Cities Be in 2035?
Cities are the engines of the modern economy. Over half of the world now lives in urban areas, and urbanization continues to shape the trajectory of global growth in unprecedented ways.
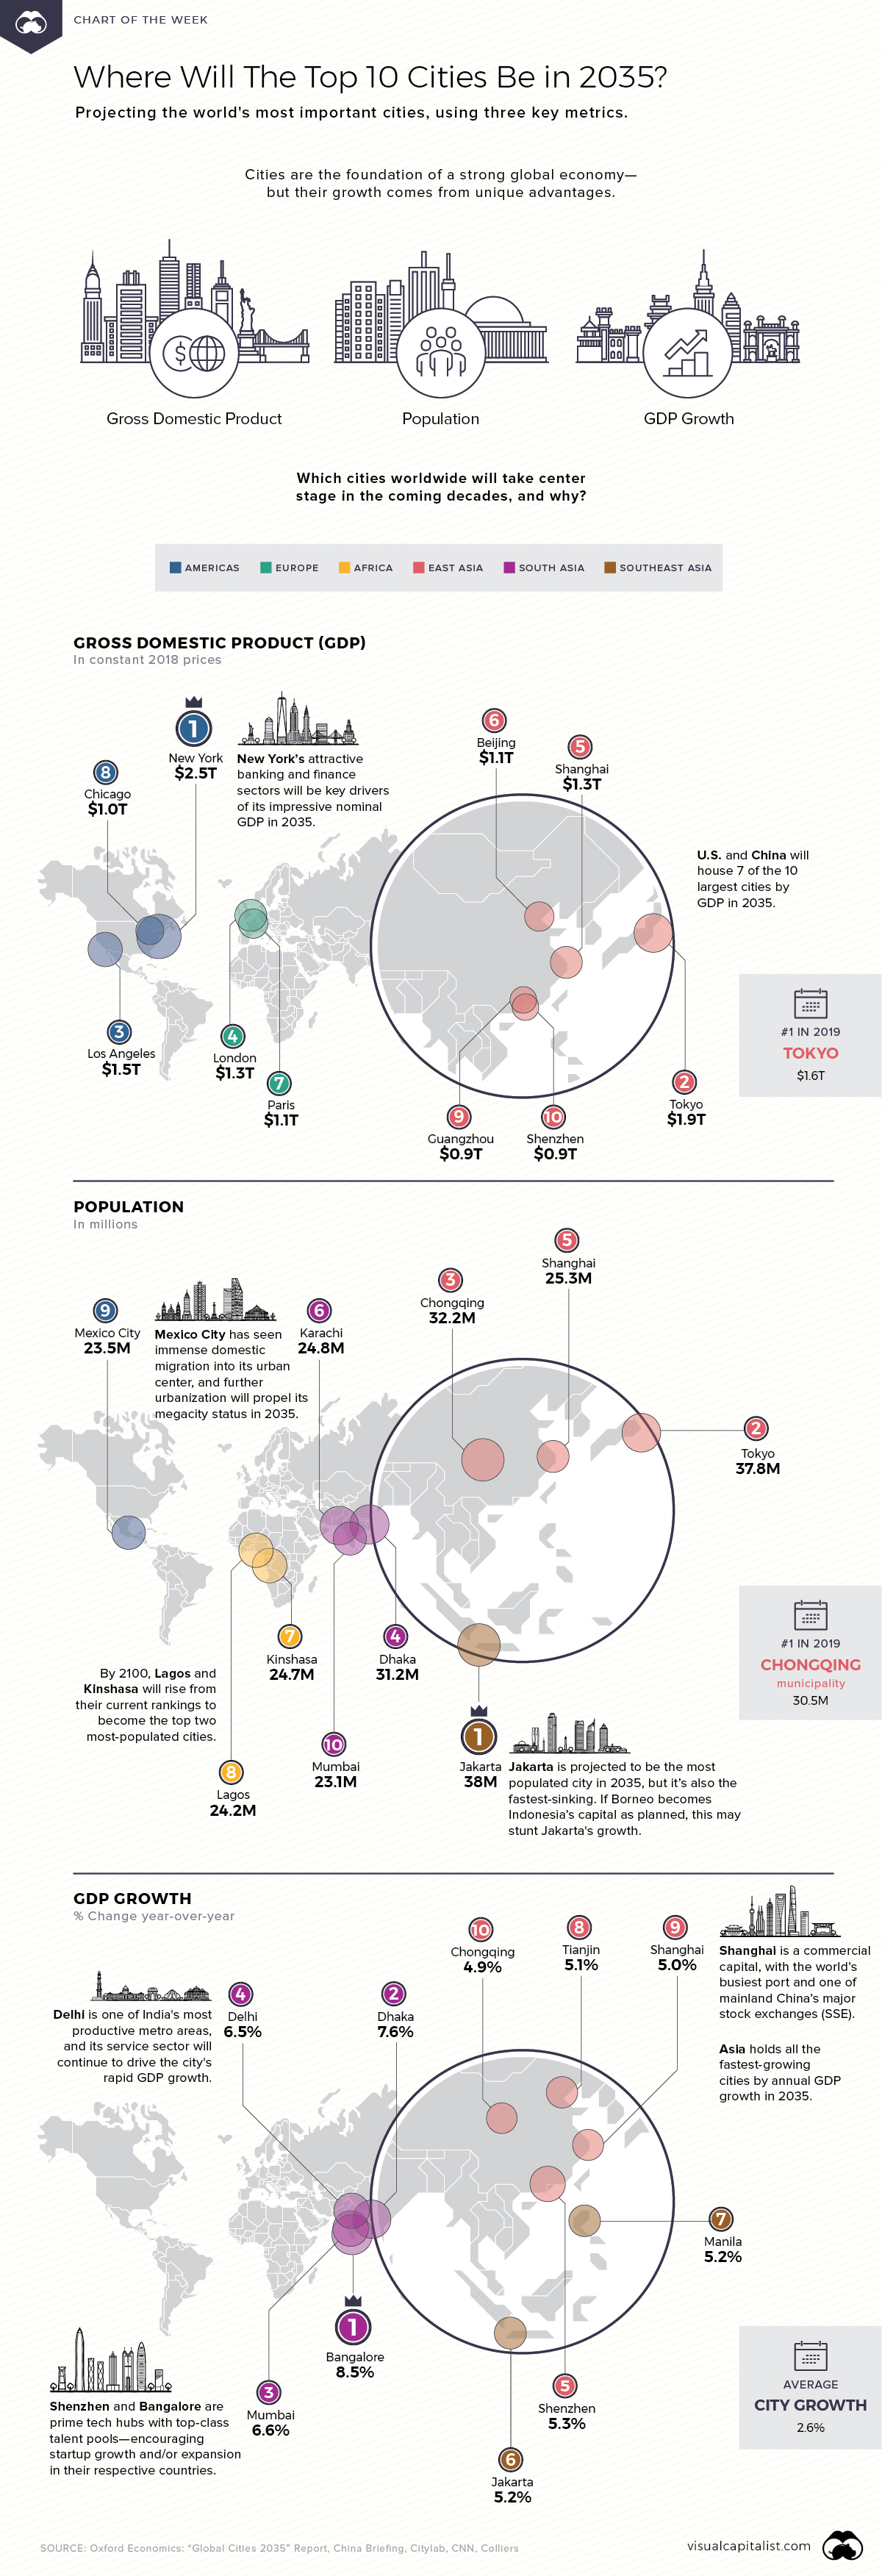
However, the most important cities of today may be quite different than those leading the charge in the future. This week’s chart looks forward to 2035, using a report by Oxford Economics to forecast the top 10 cities by measures of economic size, population, and GDP growth rate.
Each map is categorized by one of these metrics—and depending on which one you look at, the leaders vary greatly.
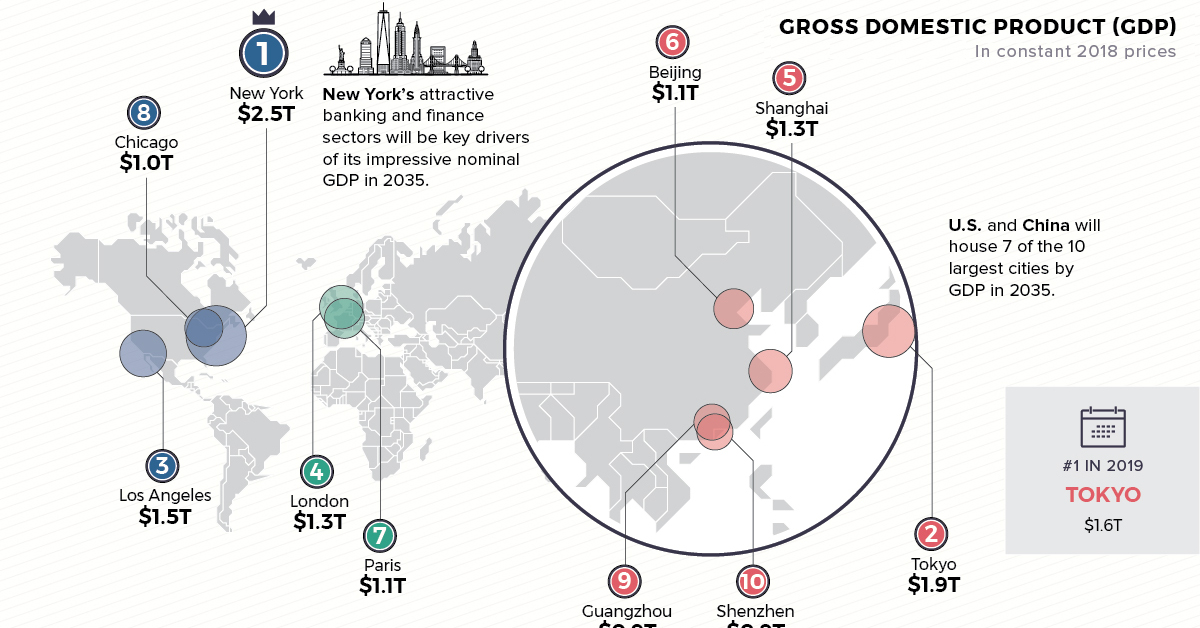
Top 10 Cities by Projected GDP
The top 10 cities by gross domestic product (GDP) in 2035 will be fairly widespread. Three cities are expected to be in the U.S.—New York, Los Angeles, and Chicago. The Big Apple’s forecasted $2.5 trillion GDP likely stems from its strong banking and finance sectors.
| Rank | City | Country | 2035 GDP |
|---|---|---|---|
| #1 | New York | 🇺🇸 United States | $2.5T |
| #2 | Tokyo | 🇯🇵 Japan | $1.9T |
| #3 | Los Angeles | 🇺🇸 United States | $1.5T |
| #4 | London | 🇬🇧 United Kingdom | $1.3T |
| #5 | Shanghai | 🇨🇳 China | $1.3T |
| #6 | Beijing | 🇨🇳 China | $1.1T |
| #7 | Paris | 🇫🇷 France | $1.1T |
| #8 | Chicago | 🇺🇸 United States | $1.0T |
| #9 | Guangzhou | 🇨🇳 China | $0.9T |
| #10 | Shenzhen | 🇨🇳 China | $0.9T |
Four cities will be found in China, while London, Paris, and Tokyo are set to round out the last three. Interestingly, Tokyo is the #1 city today, with an estimated $1.6 trillion GDP in 2019.
Altogether, these top 10 cities will contribute an impressive $13.5 trillion in GDP by 2035. Clusters of such metropolitan areas are typically considered megaregions—which account for a large share of global economic activity.
Top 10 Cities by Future Population
Next, it’s clear that top cities by population will follow a distinct global distribution. By 2035, the most highly-populated cities will shift towards the East, with seven cities located in Asia.
| Rank | City | Country | 2035 Population |
|---|---|---|---|
| #1 | Jakarta | 🇮🇩 Indonesia | 38 million |
| #2 | Tokyo | 🇯🇵 Japan | 37.8 million |
| #3 | Chongqing | 🇨🇳 China | 32.2 million |
| #4 | Dhaka | 🇧🇩 Bangladesh | 31.2 million |
| #5 | Shanghai | 🇨🇳 China | 25.3 million |
| #6 | Karachi | 🇵🇰 Pakistan | 24.8 million |
| #7 | Kinshasa | 🇨🇩 DR Congo | 24.7 million |
| #8 | Lagos | 🇳🇬 Nigeria | 24.2 million |
| #9 | Mexico City | 🇲🇽 Mexico | 23.5 million |
| #10 | Mumbai | 🇮🇳 India | 23.1 million |
While Jakarta’s 38 million-strong population is expected to emerge in first place, the city may not retain its status as Indonesia’s capital for much longer. Rising sea levels and poor water infrastructure management mean that Jakarta is rapidly sinking—and the government now plans to pivot the capital to Borneo island.
On the African continent, Kinshasa and Lagos are already among the world’s largest megacities (home to over 10 million people), and will hold top spots by the turn of the century.
Population and demographics can be major assets to a country’s growth. For example, India’s burgeoning working-age demographics will present a unique advantage—and the country is projected to contain several of the fastest growing cities in the coming years.
Top 10 Cities By Estimated Annual GDP Growth
When comparing cities based on their pace of economic growth, there are some clear standouts. Average annual GDP growth across cities is 2.6%, but the top 10 surpass this by a fair amount.
The kicker? All of 2035’s major players will be found in Asia: four of the fastest-growing cities will be in mainland China, another four in India, and the last two in Southeast Asia.
| Rank | City | Country | Annual Growth |
|---|---|---|---|
| #1 | Bengaluru | 🇮🇳 India | 8.5% |
| #2 | Dhaka | 🇧🇩 Bangladesh | 7.6% |
| #3 | Mumbai | 🇮🇳 India | 6.6% |
| #4 | Delhi | 🇮🇳 India | 6.5% |
| #5 | Shenzhen | 🇨🇳 China | 5.3% |
| #6 | Jakarta | 🇮🇩 Indonesia | 5.2% |
| #7 | Manila | 🇵🇭 Philippines | 5.2% |
| #8 | Tianjin | 🇨🇳 China | 5.1% |
| #9 | Shanghai | 🇨🇳 China | 5.0% |
| #10 | Chongqing | 🇨🇳 China | 4.9% |
At #1 by 2035 is Bangalore with an expected 8.5% annual growth forecast—its high-quality talent pool makes the city a breeding ground for tech startups. Jakarta makes another appearance, with its projected 5.2% growth at double the city average.
Shanghai finds its way onto all three lists. The commercial capital hosts the world’s busiest port, and one of China’s two major stock exchanges. These sectors could help boost Shanghai’s annual GDP growth to 5% in 2035.
Looking to the Future
Of course, any number of variables could impact these 2035 projections, from financial recessions and political uncertainty, to rapid urbanization and technological advances.
But one thing’s certain—in the coming decades, cities are where many of these factors will converge and play out.


Economy
The Most Valuable Companies in Major EU Economies
From semiconductor equipment manufacturers to supercar makers, the EU’s most valuable companies run the gamut of industries.
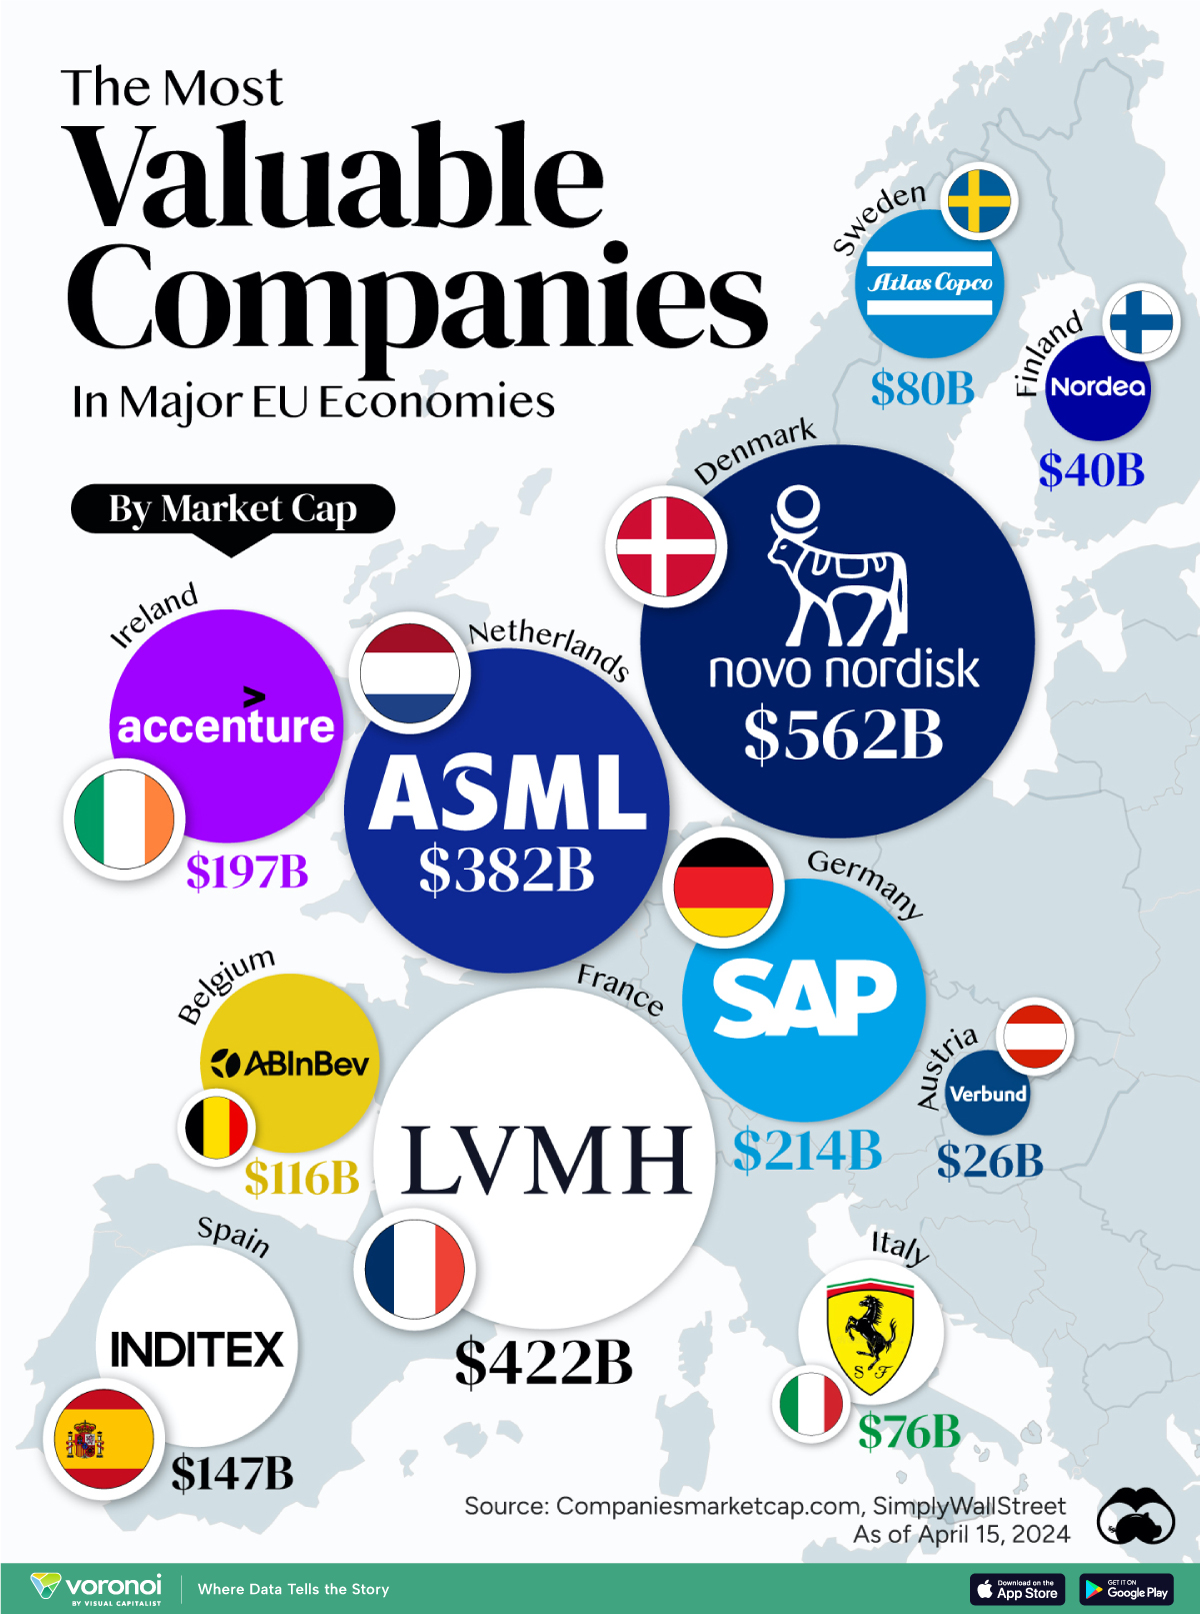
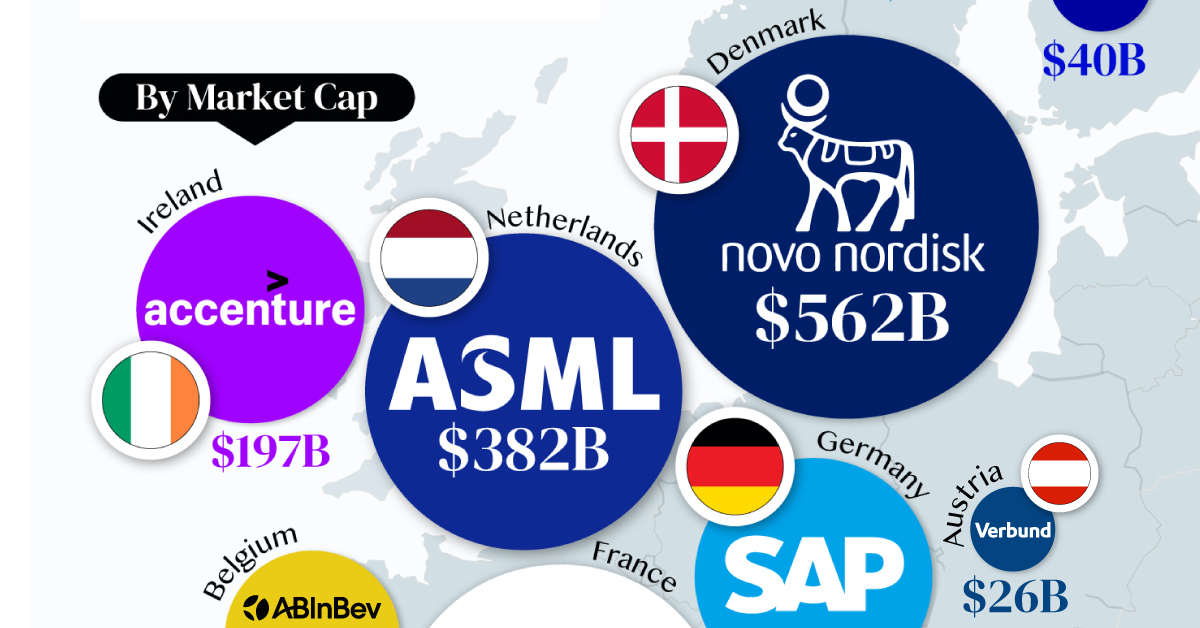
Most Valuable Companies in the EU, by Country
This was originally posted on our Voronoi app. Download the app for free on iOS or Android and discover incredible data-driven charts from a variety of trusted sources.
In this graphic, we mapped out the most valuable corporations in 11 major EU economies, based on their market capitalizations as of April 15th, 2024. All figures are in USD, and were sourced from Companiesmarketcap.com.
Novo Nordisk is currently worth more than $550 billion, making it Europe’s most valuable company by a wide margin. The pharmaceutical giant specializes in diabetes and weight-loss drugs. Demand for two of them, Ozempic and Wegovy, has surged due to their weight-loss capabilities, even causing nationwide shortages in the United States.
The following table includes an expanded list of the most valuable publicly-traded company in larger EU economies. Many of these were not included in the graphic due to space limitations.
| Country | Company | Sector | Market Cap |
|---|---|---|---|
| 🇩🇰 Denmark | 💊 Novo Nordisk | Pharmaceuticals | $562B |
| 🇫🇷 France | 👜 LVMH | Luxury Goods | $422B |
| 🇳🇱 Netherlands | 🔧 ASML | Semiconductor Equipment | $382B |
| 🇩🇪 Germany | 💼 SAP | Enterprise Software | $214B |
| 🇮🇪 Ireland | 🖥️ Accenture | IT Services | $197B |
| 🇪🇸 Spain | 👗 Inditex | Retail | $147B |
| 🇧🇪 Belgium | 🍻 Anheuser-Busch InBev | Beverages | $116B |
| 🇸🇪 Sweden | 🛠️ Atlas Copco | Industrial Equipment | $80B |
| 🇮🇹 Italy | 🏎️ Ferrari | Automotive | $76B |
| 🇫🇮 Finland | 🏦 Nordea Bank | Banking | $40B |
| 🇦🇹 Austria | 🔌 Verbund AG | Energy | $26B |
| 🇱🇺 Luxembourg | 🏗️ Tenaris | Oil & Gas Equipment | $22B |
| 🇨🇿 Czech Republic | 💡 CEZ Group | Energy | $20B |
| 🇵🇱 Poland | ⛽ PKN Orlen | Energy | $20B |
| 🇵🇹 Portugal | 🔌 EDP Group | Energy | $16B |
| 🇬🇷 Greece | 🏦 Eurobank | Banking | $7B |
| 🇭🇺 Hungary | ⛽ MOL Group | Energy | $7B |
| 🇭🇷 Croatia | 🏦 Zagrebacka Banka | Banking | $6B |
| 🇷🇴 Romania | ⛽ Romgaz | Energy | $4B |
| 🇸🇮 Slovenia | 💊 Krka | Pharmaceuticals | $4B |
Note: Figures are rounded and last updated on April 15th, 2024. Countries with top publicly-traded companies worth under $4 billion are excluded.
Luxury supergiant LVMH—which owns brands like Tiffany, Christian Dior, and TAG Heuer to name a few—is Europe’s second largest company by market cap, at $420 billion.
Rounding out the top three is ASML, which produces equipment crucial to chip manufacturers, worth $380 billion.
When looking at the region, there is a vast disparity between EU member states and their most valuable companies.
For example, as mentioned earlier, Denmark’s Novo Nordisk and France’s LVMH are worth between $400-550 billion each. Meanwhile, some countries don’t even have a single publicly-listed company that is worth over $1 billion.
In fact, only 12 EU countries (less than half of the union) are home to the top 100 most valuable companies within the bloc. An additional four countries are represented if you look at the list of the top 200 companies.

-

 Technology6 days ago
All of the Grants Given by the U.S. CHIPS Act
-

 Uranium2 weeks ago
The World’s Biggest Nuclear Energy Producers
-

 Education2 weeks ago
How Hard Is It to Get Into an Ivy League School?
-

 Debt2 weeks ago
How Debt-to-GDP Ratios Have Changed Since 2000
-

 Sports2 weeks ago
The Highest Earning Athletes in Seven Professional Sports
-

 Science2 weeks ago
Visualizing the Average Lifespans of Mammals
-

 Brands1 week ago
How Tech Logos Have Evolved Over Time
-

 Energy1 week ago
Ranked: The Top 10 EV Battery Manufacturers in 2023