Markets
Visualizing the World’s Busiest Ports
The World’s Busiest Ports
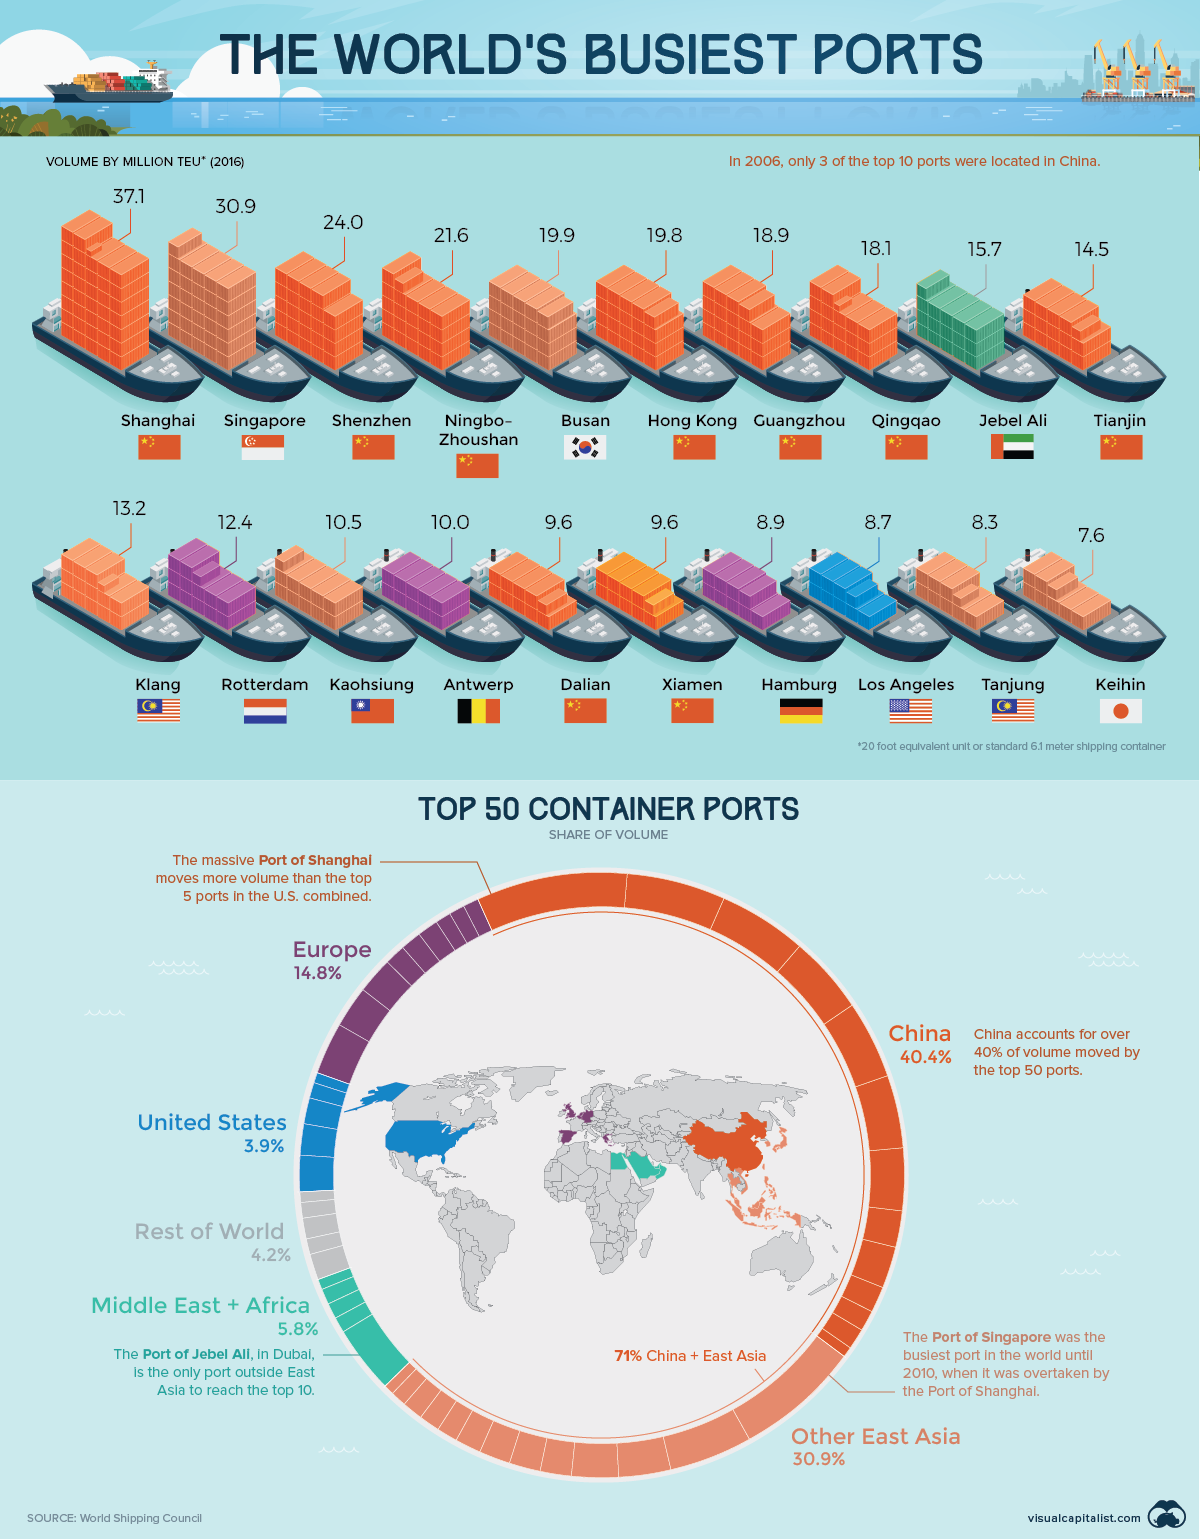
An estimated 90% of world trade is facilitated by maritime shipping, and as trade volumes continue to increase, the world’s busiest ports continue to grow larger and more efficient to meet demand.
In fact, in just the last four years, the median annual volume of the top 50 ports jumped from 5.49 to 5.86 million twenty-foot equivalent units (TEUs).
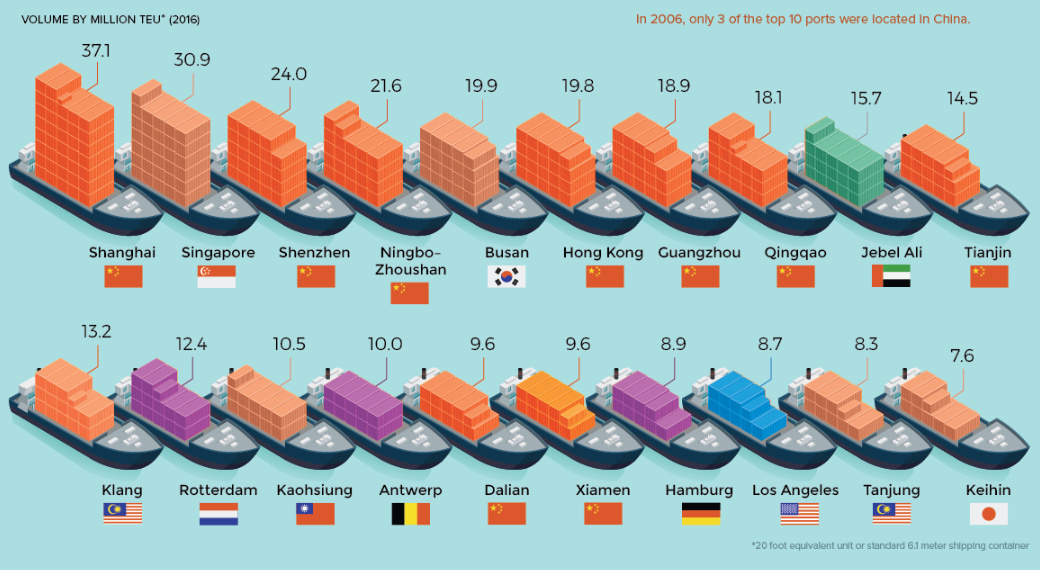
Here are the world’s 20 largest ports, using the most recent data from the World Shipping Council:
| Rank | Port Name | Country | 2016 Volume | 2012 Volume | 4-Year Change |
|---|---|---|---|---|---|
| 1 | Shanghai | 🇨🇳 China | 37.1 | 32.5 | +14% |
| 2 | Singapore | 🇸🇬 Singapore | 30.9 | 31.7 | -2% |
| 3 | Shenzhen | 🇨🇳 China | 24.0 | 22.9 | +5% |
| 4 | Ningbo-Zhoushan | 🇨🇳 China | 21.6 | 16.8 | +28% |
| 5 | Busan | 🇰🇷 S. Korea | 19.9 | 17.0 | +17% |
| 6 | Hong Kong | 🇭🇰 China | 19.8 | 23.1 | -14% |
| 7 | Guangzhou Harbor | 🇨🇳 China | 18.9 | 14.7 | +28% |
| 8 | Qingdao | 🇨🇳 China | 18.0 | 14.5 | +24% |
| 9 | Jebel Ali | 🇦🇪 U.A.E. | 15.7 | 13.3 | +18% |
| 10 | Tianjin | 🇨🇳 China | 14.5 | 12.3 | +18% |
| 11 | Port Klang | 🇲🇾 Malaysia | 13.2 | 10.0 | +32% |
| 12 | Rotterdam | 🇳🇱 Netherlands | 12.4 | 11.9 | +4% |
| 13 | Kaohsiung | 🇹🇼 Taiwan | 10.5 | 9.8 | +7% |
| 14 | Antwerp | 🇧🇪 Belgium | 10.0 | 8.6 | +16% |
| 15 | Dalian | 🇨🇳 China | 9.6 | 8.9 | +8% |
| 16 | Xiamen | 🇨🇳 China | 9.6 | 7.2 | +34% |
| 17 | Hamburg | 🇩🇪 Germany | 8.91 | 8.89 | 0% |
| 18 | Los Angeles | 🇺🇸 U.S.A. | 8.9 | 8.1 | +10% |
| 19 | Tanjung Pelepas | 🇲🇾 Malaysia | 8.3 | 7.7 | +8% |
| 20 | Keihin | 🇯🇵 Japan | 7.6 | 7.9 | -3% |
Volume is measured in millions of TEUs
Only five of the top 20 ports in the world are now located outside of East Asia. The Port of Los Angeles is the only U.S. entrant in the top 20, and only three European ports made the cut.
Today, trade is more likely than ever to flow through the South China Sea.
Ruling the High Seas
From dollar store knick-knacks to nuclear reactor components, China’s manufacturing output is a critical link in the global supply chain. Getting all those products to consumers and companies around the world is big business, and over the past decade, China has emerged as the heavyweight champion of world shipping.
While Danish company, Maersk, is still the largest shipping line, an ever increasing share of the world’s container traffic is moving through Chinese controlled ports. An estimated two-thirds of container traffic now passes through Chinese ports or ports that have received Chinese investment.
New Kids on the Block
While shipping volumes on a global basis continue to rise, not all of that growth has been spread around equally. This is particularly true for established titans of the South China Sea.
At the outset of this millennium, Hong Kong and Singapore were home to the busiest ports in the world. Today, both are facing increased competition from neighboring ports, as well as declining volumes:
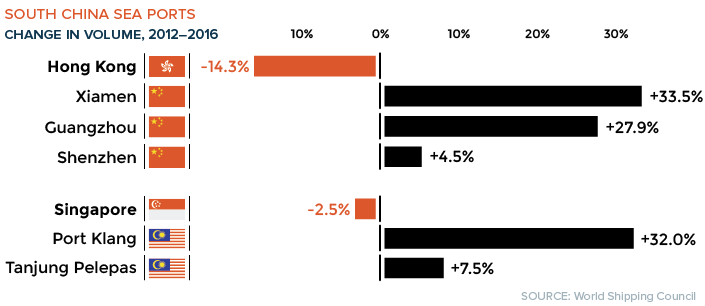
In contrast, the massive Port of Shanghai saw a 71% increase over the last decade, and many other Chinese ports has seen significant growth in volume in recent years.
If China’s One Belt One Road initiatives and investments in global port facilities are any indication, the country’s domination of maritime shipping will only continue to strengthen in the near term.


Markets
The European Stock Market: Attractive Valuations Offer Opportunities
On average, the European stock market has valuations that are nearly 50% lower than U.S. valuations. But how can you access the market?


European Stock Market: Attractive Valuations Offer Opportunities
Europe is known for some established brands, from L’Oréal to Louis Vuitton. However, the European stock market offers additional opportunities that may be lesser known.
The above infographic, sponsored by STOXX, outlines why investors may want to consider European stocks.
Attractive Valuations
Compared to most North American and Asian markets, European stocks offer lower or comparable valuations.
| Index | Price-to-Earnings Ratio | Price-to-Book Ratio |
|---|---|---|
| EURO STOXX 50 | 14.9 | 2.2 |
| STOXX Europe 600 | 14.4 | 2 |
| U.S. | 25.9 | 4.7 |
| Canada | 16.1 | 1.8 |
| Japan | 15.4 | 1.6 |
| Asia Pacific ex. China | 17.1 | 1.8 |
Data as of February 29, 2024. See graphic for full index names. Ratios based on trailing 12 month financials. The price to earnings ratio excludes companies with negative earnings.
On average, European valuations are nearly 50% lower than U.S. valuations, potentially offering an affordable entry point for investors.
Research also shows that lower price ratios have historically led to higher long-term returns.
Market Movements Not Closely Connected
Over the last decade, the European stock market had low-to-moderate correlation with North American and Asian equities.
The below chart shows correlations from February 2014 to February 2024. A value closer to zero indicates low correlation, while a value of one would indicate that two regions are moving in perfect unison.
| EURO STOXX 50 | STOXX EUROPE 600 | U.S. | Canada | Japan | Asia Pacific ex. China |
|
|---|---|---|---|---|---|---|
| EURO STOXX 50 | 1.00 | 0.97 | 0.55 | 0.67 | 0.24 | 0.43 |
| STOXX EUROPE 600 | 1.00 | 0.56 | 0.71 | 0.28 | 0.48 | |
| U.S. | 1.00 | 0.73 | 0.12 | 0.25 | ||
| Canada | 1.00 | 0.22 | 0.40 | |||
| Japan | 1.00 | 0.88 | ||||
| Asia Pacific ex. China | 1.00 |
Data is based on daily USD returns.
European equities had relatively independent market movements from North American and Asian markets. One contributing factor could be the differing sector weights in each market. For instance, technology makes up a quarter of the U.S. market, but health care and industrials dominate the broader European market.
Ultimately, European equities can enhance portfolio diversification and have the potential to mitigate risk for investors.
Tracking the Market
For investors interested in European equities, STOXX offers a variety of flagship indices:
| Index | Description | Market Cap |
|---|---|---|
| STOXX Europe 600 | Pan-regional, broad market | €10.5T |
| STOXX Developed Europe | Pan-regional, broad-market | €9.9T |
| STOXX Europe 600 ESG-X | Pan-regional, broad market, sustainability focus | €9.7T |
| STOXX Europe 50 | Pan-regional, blue-chip | €5.1T |
| EURO STOXX 50 | Eurozone, blue-chip | €3.5T |
Data is as of February 29, 2024. Market cap is free float, which represents the shares that are readily available for public trading on stock exchanges.
The EURO STOXX 50 tracks the Eurozone’s biggest and most traded companies. It also underlies one of the world’s largest ranges of ETFs and mutual funds. As of November 2023, there were €27.3 billion in ETFs and €23.5B in mutual fund assets under management tracking the index.
“For the past 25 years, the EURO STOXX 50 has served as an accurate, reliable and tradable representation of the Eurozone equity market.”
— Axel Lomholt, General Manager at STOXX
Partnering with STOXX to Track the European Stock Market
Are you interested in European equities? STOXX can be a valuable partner:
- Comprehensive, liquid and investable ecosystem
- European heritage, global reach
- Highly sophisticated customization capabilities
- Open architecture approach to using data
- Close partnerships with clients
- Part of ISS STOXX and Deutsche Börse Group
With a full suite of indices, STOXX can help you benchmark against the European stock market.
Learn how STOXX’s European indices offer liquid and effective market access.

-

 Economy2 days ago
Economic Growth Forecasts for G7 and BRICS Countries in 2024
The IMF has released its economic growth forecasts for 2024. How do the G7 and BRICS countries compare?
-

 Markets1 week ago
U.S. Debt Interest Payments Reach $1 Trillion
U.S. debt interest payments have surged past the $1 trillion dollar mark, amid high interest rates and an ever-expanding debt burden.
-

 United States2 weeks ago
Ranked: The Largest U.S. Corporations by Number of Employees
We visualized the top U.S. companies by employees, revealing the massive scale of retailers like Walmart, Target, and Home Depot.
-

 Markets2 weeks ago
The Top 10 States by Real GDP Growth in 2023
This graphic shows the states with the highest real GDP growth rate in 2023, largely propelled by the oil and gas boom.
-

 Markets2 weeks ago
Ranked: The World’s Top Flight Routes, by Revenue
In this graphic, we show the highest earning flight routes globally as air travel continued to rebound in 2023.
-

 Markets3 weeks ago
Ranked: The Most Valuable Housing Markets in America
The U.S. residential real estate market is worth a staggering $47.5 trillion. Here are the most valuable housing markets in the country.


-

 Debt1 week ago
How Debt-to-GDP Ratios Have Changed Since 2000
-
Markets2 weeks ago
Ranked: The World’s Top Flight Routes, by Revenue
-

 Countries2 weeks ago
Population Projections: The World’s 6 Largest Countries in 2075
-
Markets2 weeks ago
The Top 10 States by Real GDP Growth in 2023
-

 Demographics2 weeks ago
The Smallest Gender Wage Gaps in OECD Countries
-

 United States2 weeks ago
Where U.S. Inflation Hit the Hardest in March 2024
-

 Green2 weeks ago
Top Countries By Forest Growth Since 2001
-
United States2 weeks ago
Ranked: The Largest U.S. Corporations by Number of Employees