Politics
Chart: The Most Influential Countries in Asia
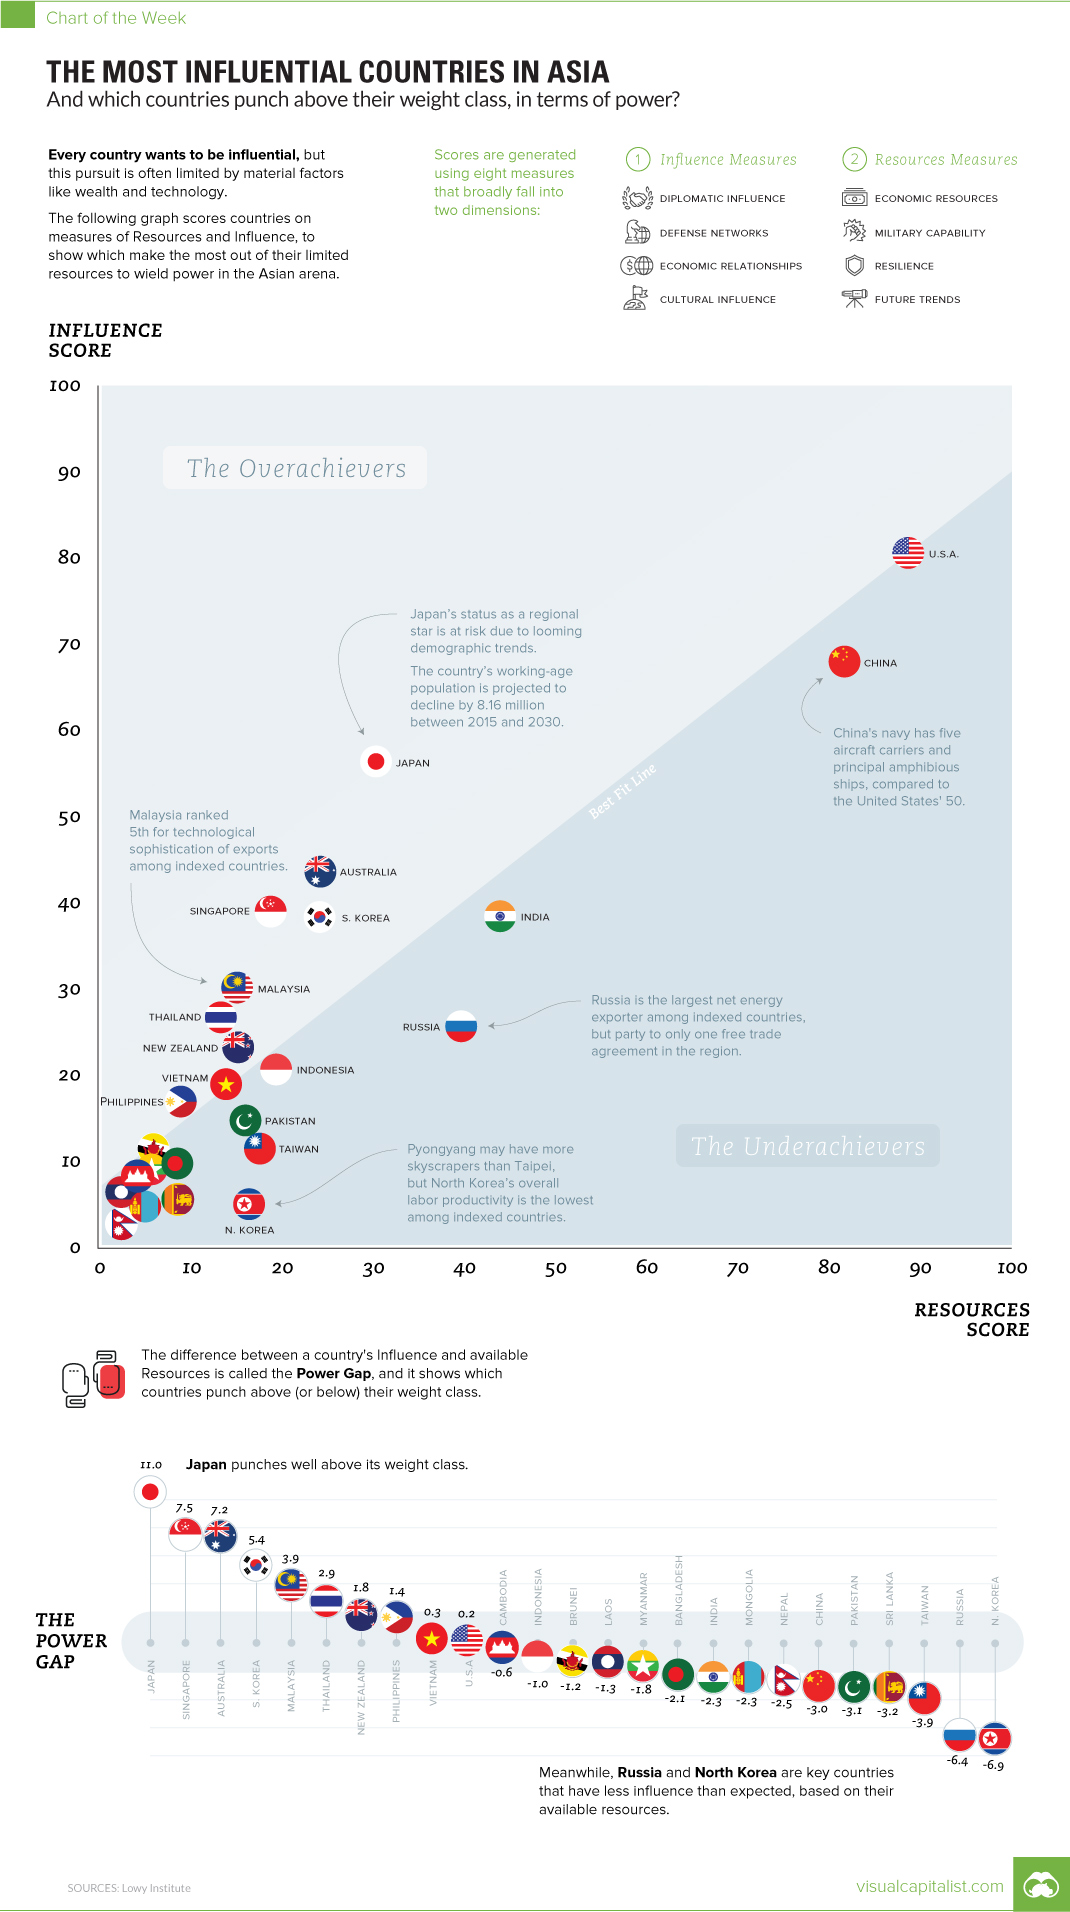
Chart: The Most Influential Countries in Asia
The Chart of the Week is a weekly Visual Capitalist feature on Fridays.
They say the pen is mightier than the sword.
However, what they often fail to mention is that the pen is even mightier when it comes with massive amounts of leverage, influence, and power backing it up on every stroke.
How to Win Friends and Influence Countries
Every country is interested in gaining influence, and earlier this week we showed you an interactive infographic from the Lowy Institute that compared the strength of Asian powers to the United States.
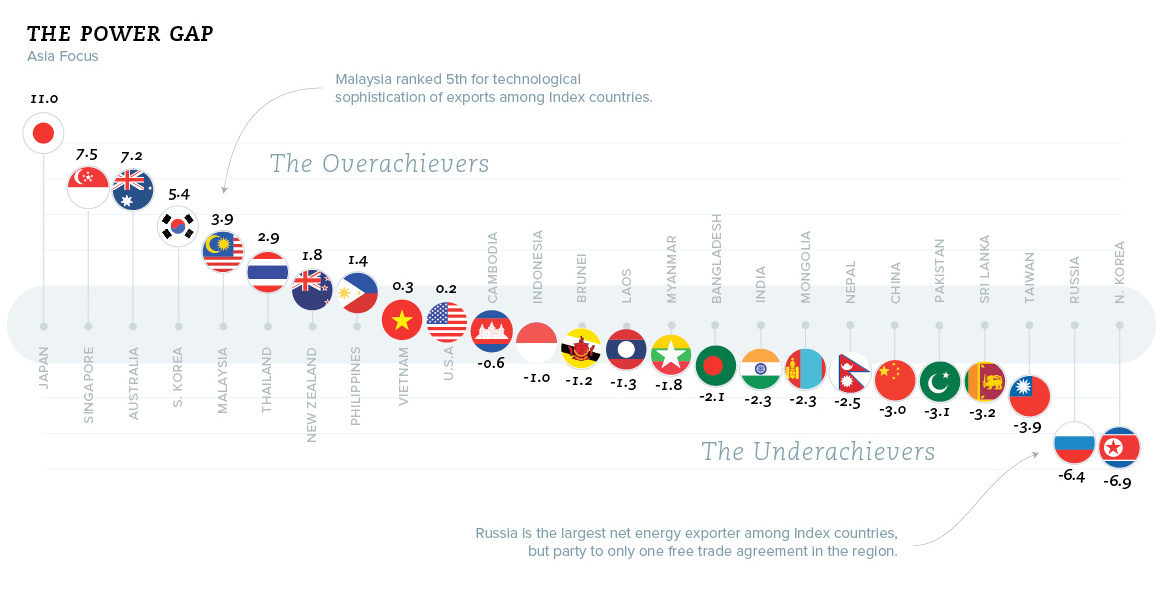
Today’s chart uses the same data set, and it not only highlights the most influential countries in the Asian arena, but it also plots resources (i.e. the potential for power) of countries against their actual level of influence. The Lowy Institute calls this the “Power Gap” and it is intended to show whether a country is overperforming or underperforming in terms of fulfilling its expected level of influence on the region.
Here are descriptions of the two measures which are used for the Power Gap:
Resources: A score based on economic resources, military capability, resilience, and future trends, this measurement provides an assessment of a country’s material capabilities and robustness, which are requisite factors in the exercise of power.
Influence: A score based on diplomatic influence, economic relationships, defense networks, and cultural influence, this measurement is used to assess a country’s level of influence on other countries in the Asian arena.
Next, we’ll look at the actual numbers to see what we can learn.
Measuring Influence
Here’s how countries perform – as a reminder, this is based on the Asia Power Index, which is made up of countries in the Asia-Pacific region and the United States.
| Rank | Country | Overall Power | Expected Power | Power Gap |
|---|---|---|---|---|
| #1 | United States | 85.0 | 84.8 | 0.2 |
| #2 | China | 75.5 | 78.6 | -3.0 |
| #3 | Japan | 42.1 | 31.1 | 11.0 |
| #4 | India | 41.5 | 43.8 | -2.3 |
| #5 | Russia | 33.3 | 39.7 | -6.4 |
| #6 | Australia | 32.5 | 25.4 | 7.2 |
| #7 | South Korea | 30.7 | 25.3 | 5.4 |
| #8 | Singapore | 27.9 | 20.4 | 7.5 |
| #9 | Malaysia | 20.6 | 16.7 | 3.9 |
| #10 | Indonesia | 20.0 | 20.9 | -1.0 |
| #11 | Thailand | 19.2 | 16.3 | 2.9 |
| #12 | New Zealand | 18.9 | 17.1 | 1.8 |
| #13 | Vietnam | 16.5 | 16.2 | 0.3 |
| #14 | Pakistan | 15.1 | 18.2 | -3.1 |
| #15 | Taiwan | 14.9 | 18.8 | -3.9 |
| #16 | Philippines | 12.4 | 11.0 | 1.4 |
| #17 | North Korea | 11.4 | 18.3 | -6.9 |
| #18 | Bangladesh | 8.7 | 10.9 | -2.2 |
| #19 | Brunei | 8.2 | 9.4 | -1.2 |
| #20 | Myanmar | 7.6 | 9.4 | -1.8 |
| #21 | Sri Lanka | 7.6 | 10.8 | -3.2 |
| #22 | Cambodia | 6.1 | 6.7 | -0.6 |
| #23 | Mongolia | 5.0 | 7.3 | -2.3 |
| #24 | Laos | 4.8 | 6.1 | -1.3 |
| #25 | Nepal | 3.1 | 5.6 | -2.5 |
In terms of absolute power, the U.S. and China top the list. Interestingly, Russia is only 5th place overall.
The “Power Gap” partially seems to explain this, as Russia appears to have the biggest gap between its expected power and its actual power. The country has the second worst power gap at -6.4.
Looking at the opposite end of the spectrum, it appears Japan, Singapore, and Australia are all punching above their weight in terms of influence. Meanwhile, Malaysia has the 5th best power gap, which may be unexpected for many.


Economy
The Bloc Effect: International Trade with Geopolitical Allies on the Rise
Rising geopolitical tensions are shaping the future of international trade, but what is the effect on trading among G7 and BRICS countries?


The Bloc Effect: International Trade with Allies on the Rise
International trade has become increasingly fragmented over the last five years as countries have shifted to trading more with their geopolitical allies.
This graphic from The Hinrich Foundation, the first in a three-part series covering the future of trade, provides visual context to the growing divide in trade in G7 and pre-expansion BRICS countries, which are used as proxies for geopolitical blocs.
Trade Shifts in G7 and BRICS Countries
This analysis uses IMF data to examine differences in shares of exports within and between trading blocs from 2018 to 2023. For example, we looked at the percentage of China’s exports with other BRICS members as well as with G7 members to see how these proportions shifted in percentage points (pp) over time.
Countries traded nearly $270 billion more with allies in 2023 compared to 2018. This shift came at the expense of trade with rival blocs, which saw a decline of $314 billion.
Country Change in Exports Within Bloc (pp) Change in Exports With Other Bloc (pp)
🇮🇳 India 0.0 3.9
🇷🇺 Russia 0.7 -3.8
🇮🇹 Italy 0.8 -0.7
🇨🇦 Canada 0.9 -0.7
🇫🇷 France 1.0 -1.1
🇪🇺 EU 1.1 -1.5
🇩🇪 Germany 1.4 -2.1
🇿🇦 South Africa 1.5 1.5
🇺🇸 U.S. 1.6 -0.4
🇯🇵 Japan 2.0 -1.7
🇨🇳 China 2.1 -5.2
🇧🇷 Brazil 3.7 -3.3
🇬🇧 UK 10.2 0.5
All shifts reported are in percentage points. For example, the EU saw its share of exports to G7 countries rise from 74.3% in 2018 to 75.4% in 2023, which equates to a 1.1 percentage point increase.
The UK saw the largest uptick in trading with other countries within the G7 (+10.2 percentage points), namely the EU, as the post-Brexit trade slump to the region recovered.
Meanwhile, the U.S.-China trade dispute caused China’s share of exports to the G7 to fall by 5.2 percentage points from 2018 to 2023, the largest decline in our sample set. In fact, partly as a result of the conflict, the U.S. has by far the highest number of harmful tariffs in place.
The Russia-Ukraine War and ensuing sanctions by the West contributed to Russia’s share of exports to the G7 falling by 3.8 percentage points over the same timeframe.
India, South Africa, and the UK bucked the trend and continued to witness advances in exports with the opposing bloc.
Average Trade Shifts of G7 and BRICS Blocs
Though results varied significantly on a country-by-country basis, the broader trend towards favoring geopolitical allies in international trade is clear.
Bloc Change in Exports Within Bloc (pp) Change in Exports With Other Bloc (pp)
Average 2.1 -1.1
BRICS 1.6 -1.4
G7 incl. EU 2.4 -1.0
Overall, BRICS countries saw a larger shift away from exports with the other bloc, while for G7 countries the shift within their own bloc was more pronounced. This implies that though BRICS countries are trading less with the G7, they are relying more on trade partners outside their bloc to make up for the lost G7 share.
A Global Shift in International Trade and Geopolitical Proximity
The movement towards strengthening trade relations based on geopolitical proximity is a global trend.
The United Nations categorizes countries along a scale of geopolitical proximity based on UN voting records.
According to the organization’s analysis, international trade between geopolitically close countries rose from the first quarter of 2022 (when Russia first invaded Ukraine) to the third quarter of 2023 by over 6%. Conversely, trade with geopolitically distant countries declined.
The second piece in this series will explore China’s gradual move away from using the U.S. dollar in trade settlements.
Visit the Hinrich Foundation to learn more about the future of geopolitical trade

-

 Economy2 days ago
Economic Growth Forecasts for G7 and BRICS Countries in 2024
The IMF has released its economic growth forecasts for 2024. How do the G7 and BRICS countries compare?
-

 United States2 weeks ago
Ranked: The Largest U.S. Corporations by Number of Employees
We visualized the top U.S. companies by employees, revealing the massive scale of retailers like Walmart, Target, and Home Depot.
-

 Economy2 weeks ago
Where U.S. Inflation Hit the Hardest in March 2024
We visualized product categories that saw the highest % increase in price due to U.S. inflation as of March 2024.
-

 Economy4 weeks ago
G20 Inflation Rates: Feb 2024 vs COVID Peak
We visualize inflation rates across G20 countries as of Feb 2024, in the context of their COVID-19 pandemic peak.
-

 Economy1 month ago
Mapped: Unemployment Claims by State
This visual heatmap of unemployment claims by state highlights New York, California, and Alaska leading the country by a wide margin.
-

 Economy2 months ago
Confidence in the Global Economy, by Country
Will the global economy be stronger in 2024 than in 2023?


-

 Energy1 week ago
The World’s Biggest Nuclear Energy Producers
-

 Money2 weeks ago
Which States Have the Highest Minimum Wage in America?
-

 Technology2 weeks ago
Ranked: Semiconductor Companies by Industry Revenue Share
-

 Markets2 weeks ago
Ranked: The World’s Top Flight Routes, by Revenue
-

 Demographics2 weeks ago
Population Projections: The World’s 6 Largest Countries in 2075
-

 Markets2 weeks ago
The Top 10 States by Real GDP Growth in 2023
-

 Demographics2 weeks ago
The Smallest Gender Wage Gaps in OECD Countries
-
Economy2 weeks ago
Where U.S. Inflation Hit the Hardest in March 2024