Energy
Explaining the Surging Demand for Lithium-Ion Batteries
The Battery Series
Part 3: Explaining the Surging Demand for Lithium-Ion Batteries
The Battery Series is a five-part infographic series that explores what investors need to know about modern battery technology, including raw material supply, demand, and future applications.
Presented by: Nevada Energy Metals, eCobalt Solutions Inc., and Great Lakes Graphite


Explaining the Surging Demand for Lithium-Ion Batteries
In Parts 1 and 2, we examined the evolution of battery technology as well as what batteries can and cannot do. In this part, we will tackle demand in the rechargeable battery market, with a major focus on the rapidly growing lithium-ion segment.
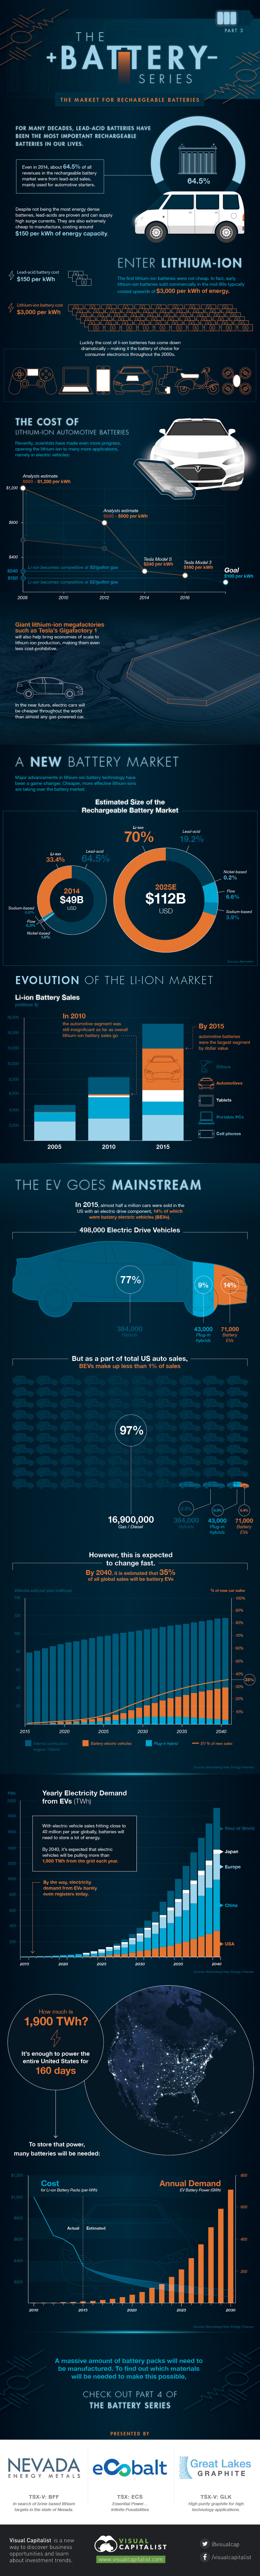
For many decades, lead-acid batteries have been the most important rechargeable batteries in our lives.
Even in 2014, about 64.5% of all revenues in the rechargeable battery market were from lead-acid sales, mainly to be used for automotive starters.


Why?
Despite not being the most energy dense batteries, lead-acids are proven and can supply high surge currents. They are also extremely cheap to manufacture, costing around $150 per kWh of energy capacity.
Enter Lithium-Ion
The first lithium-ions were not cheap. In fact, early batteries produced commercially in the mid-90s typically costed upwards of $3,000 per kWh of energy.
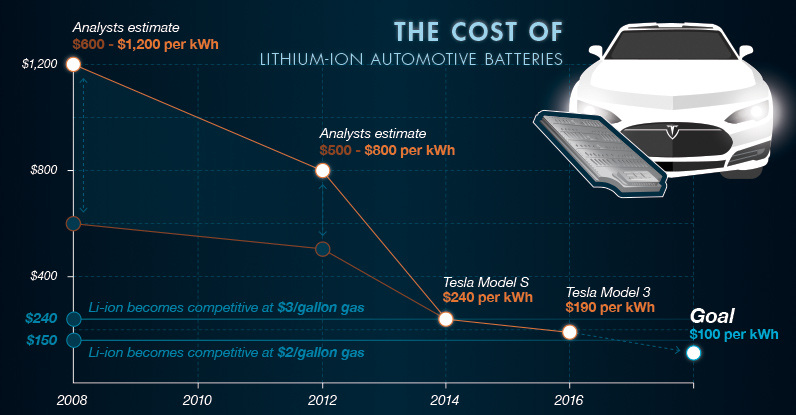
Luckily, the cost of lithium-ion batteries has come down dramatically, making it the battery of choice for consumer electronics throughout the 2000s. And recently, scientists have made even more progress, opening the lithium-ion to many more applications, namely in electric vehicles.
In 2008, analysts estimated that lithium-ion battery packs costed $600-$1,200 per kWh, but this range would drop to $500-800 per kWh over the following four years. Tesla now claims that a Tesla Model S battery cost is $240 per kWh and that the expected cost for a Model 3 is $190 per kWh.
At $240 kWh, lithium-ions become competitive with $3/gallon gas. At $150, they are even competitive with $2 gas.
Giant megafactories such as Tesla’s Gigafactory 1 will also help bring economies of scale to lithium-ion production, making them even less cost-prohibitive. Soon battery packs will cost closer to $100 per kWh, which will make them essentially cheaper than all gas-powered vehicles.
Demand for Lithium-Ion Batteries
Major advancements in lithium-ion battery technology have been a game-changer. Cheaper, more-effective lithium-ions are now taking over the battery market.
In 2014, lithium-ions made up 33.4% of the rechargeable battery market worldwide, worth $49 billion. By 2025, it is estimated by Bernstein that the rechargeable battery market will more than double in size to $112 billion, while lithium-ion’s market share will more than double to 70.0%.
The key driver? The automotive segment.
In 2010, the automotive sector was a drop in the bucket for lithium-ion battery sales. Five years later, automotive made up more than $5 billion of sales in a sector worth nearly $16 billion.
The EV Goes Mainstream
In 2015, almost half a million cars were sold in the US with an electric drive component.
14% of these sales were battery electric vehicles (BEVs):
- 71,000 Battery EVs (14%)
- 43,000 plug-in hybrids (9%)
- 384,000 hybrids (77%)
= 498,000 electric drive vehicles
But as a part of total US auto sales, BEVs still made up less than 1% of sales:
- 71,000 battery EVs (0.4%)
- 43,000 plug-in hybrids (0.3%)
- 384,000 hybrids (2.3%)
- 16,900,000 gas/diesel sales (97%)
However, in the near future, this is expected to change fast. By 2040, approximately 35% of all global sales will be BEVs.
This will put electric vehicle sales at close to 40 million per year globally, meaning a lot of energy will need to be stored by batteries. Bloomberg New Energy Finance expects that at this point, that electric vehicles will be pulling more than 1,900 TWh from the grid each year.
How much is 1,900 TWh? It’s enough to power the entire United States for 160 days.
And to meet this demand for lithium-ion powered vehicles, a massive amount of battery packs will need to be manufactured.
Part 4 of The Battery Series looks at which materials will be needed to make this possible.


Energy
Charted: 4 Reasons Why Lithium Could Be the Next Gold Rush
Visual Capitalist has partnered with EnergyX to show why drops in prices and growing demand may make now the right time to invest in lithium.


4 Reasons Why You Should Invest in Lithium
Lithium’s importance in powering EVs makes it a linchpin of the clean energy transition and one of the world’s most precious minerals.
In this graphic, Visual Capitalist partnered with EnergyX to explore why now may be the time to invest in lithium.
1. Lithium Prices Have Dropped
One of the most critical aspects of evaluating an investment is ensuring that the asset’s value is higher than its price would indicate. Lithium is integral to powering EVs, and, prices have fallen fast over the last year:
| Date | LiOH·H₂O* | Li₂CO₃** |
|---|---|---|
| Feb 2023 | $76 | $71 |
| March 2023 | $71 | $61 |
| Apr 2023 | $43 | $33 |
| May 2023 | $43 | $33 |
| June 2023 | $47 | $45 |
| July 2023 | $44 | $40 |
| Aug 2023 | $35 | $35 |
| Sept 2023 | $28 | $27 |
| Oct 2023 | $24 | $23 |
| Nov 2023 | $21 | $21 |
| Dec 2023 | $17 | $16 |
| Jan 2024 | $14 | $15 |
| Feb 2024 | $13 | $14 |
Note: Monthly spot prices were taken as close to the 14th of each month as possible.
*Lithium hydroxide monohydrate MB-LI-0033
**Lithium carbonate MB-LI-0029
2. Lithium-Ion Battery Prices Are Also Falling
The drop in lithium prices is just one reason to invest in the metal. Increasing economies of scale, coupled with low commodity prices, have caused the cost of lithium-ion batteries to drop significantly as well.
In fact, BNEF reports that between 2013 and 2023, the price of a Li-ion battery dropped by 82%.
| Year | Price per KWh |
|---|---|
| 2023 | $139 |
| 2022 | $161 |
| 2021 | $150 |
| 2020 | $160 |
| 2019 | $183 |
| 2018 | $211 |
| 2017 | $258 |
| 2016 | $345 |
| 2015 | $448 |
| 2014 | $692 |
| 2013 | $780 |

3. EV Adoption is Sustainable
One of the best reasons to invest in lithium is that EVs, one of the main drivers behind the demand for lithium, have reached a price point similar to that of traditional vehicle.
According to the Kelly Blue Book, Tesla’s average transaction price dropped by 25% between 2022 and 2023, bringing it in line with many other major manufacturers and showing that EVs are a realistic transport option from a consumer price perspective.
| Manufacturer | September 2022 | September 2023 |
|---|---|---|
| BMW | $69,000 | $72,000 |
| Ford | $54,000 | $56,000 |
| Volkswagon | $54,000 | $56,000 |
| General Motors | $52,000 | $53,000 |
| Tesla | $68,000 | $51,000 |
4. Electricity Demand in Transport is Growing
As EVs become an accessible transport option, there’s an investment opportunity in lithium. But possibly the best reason to invest in lithium is that the IEA reports global demand for the electricity in transport could grow dramatically by 2030:
| Transport Type | 2022 | 2025 | 2030 |
|---|---|---|---|
| Buses 🚌 | 23,000 GWh | 50,000 GWh | 130,000 GWh |
| Cars 🚙 | 65,000 GWh | 200,000 GWh | 570,000 GWh |
| Trucks 🛻 | 4,000 GWh | 15,000 GWh | 94,000 GWh |
| Vans 🚐 | 6,000 GWh | 16,000 GWh | 72,000 GWh |
The Lithium Investment Opportunity
Lithium presents a potentially classic investment opportunity. Lithium and battery prices have dropped significantly, and recently, EVs have reached a price point similar to other vehicles. By 2030, the demand for clean energy, especially in transport, will grow dramatically.
With prices dropping and demand skyrocketing, now is the time to invest in lithium.
EnergyX is poised to exploit lithium demand with cutting-edge lithium extraction technology capable of extracting 300% more lithium than current processes.

-

 Lithium4 days ago
Ranked: The Top 10 EV Battery Manufacturers in 2023
Asia dominates this ranking of the world’s largest EV battery manufacturers in 2023.
-

 Energy1 week ago
The World’s Biggest Nuclear Energy Producers
China has grown its nuclear capacity over the last decade, now ranking second on the list of top nuclear energy producers.
-

 Energy1 month ago
The World’s Biggest Oil Producers in 2023
Just three countries accounted for 40% of global oil production last year.
-

 Energy1 month ago
How Much Does the U.S. Depend on Russian Uranium?
Currently, Russia is the largest foreign supplier of nuclear power fuel to the U.S.
-

 Uranium2 months ago
Charted: Global Uranium Reserves, by Country
We visualize the distribution of the world’s uranium reserves by country, with 3 countries accounting for more than half of total reserves.
-

 Energy3 months ago
Visualizing the Rise of the U.S. as Top Crude Oil Producer
Over the last decade, the United States has established itself as the world’s top producer of crude oil, surpassing Saudi Arabia and Russia.

-

 Debt1 week ago
How Debt-to-GDP Ratios Have Changed Since 2000
-

 Markets2 weeks ago
Ranked: The World’s Top Flight Routes, by Revenue
-

 Countries2 weeks ago
Population Projections: The World’s 6 Largest Countries in 2075
-

 Markets2 weeks ago
The Top 10 States by Real GDP Growth in 2023
-

 Demographics2 weeks ago
The Smallest Gender Wage Gaps in OECD Countries
-

 United States2 weeks ago
Where U.S. Inflation Hit the Hardest in March 2024
-

 Green2 weeks ago
Top Countries By Forest Growth Since 2001
-

 United States2 weeks ago
Ranked: The Largest U.S. Corporations by Number of Employees