Technology
The Evolution of Battery Technology
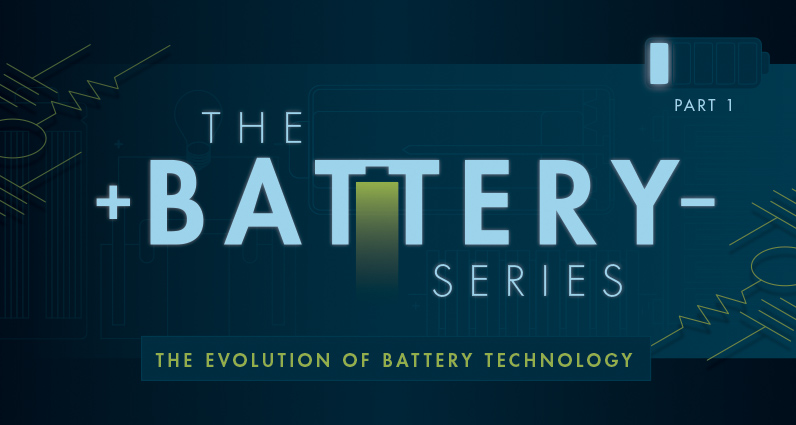
The Battery Series
Part 1: The Evolution of Battery Technology
The Battery Series is a five-part infographic series that explores what investors need to know about modern battery technology, including raw material supply, demand, and future applications.
Presented by: Nevada Energy Metals, eCobalt Solutions Inc., and Great Lakes Graphite


Introduction to The Battery Series
Today, how we store energy is just as important as how we create it.
Battery technology already makes electric cars possible, as well as helping us to store emergency power, fly satellites, and use portable electronic devices.
But tomorrow, could you be boarding a battery-powered airplane, or living in a city powered at night by solar energy?
The Battery Series is a five-part infographic series that explores how batteries work, the players in the market, the materials needed to build batteries, and how future battery developments may affect the world. This is Part 1, which looks at the basics of batteries and the history of battery technology.


Battery Basics
Batteries convert stored chemical energy directly into electrical energy. Batteries have three main components:
(-) Anode:The negative electrode that gets oxidized, releasing electrons
(+) Cathode: The positive electrode that is reduced, by acquiring electrons
Electrolyte: The medium that provides the ion transport mechanism between the cathode and anode of a cell. It can be liquid or solid.
At the most basic level, batteries are very simple. In fact, a primitive battery can even be made with a copper penny, galvanized nail (zinc), and a lemon or potato.
The Evolution of Battery Technology
While creating a simple battery is quite easy, the challenge is that making a good battery is very difficult. Balancing power, weight, cost, and other factors involves managing many trade-offs, and scientists have worked for hundreds of years to get to today’s level of efficiency.
Here’s a brief history of how batteries have changed over the years:
Voltaic Pile (1799)
Italian physicist Alessandro Volta, in 1799, created the first electrical battery that could provide continuous electrical current to a circuit. The voltaic pile used zinc and copper for electrodes with brine-soaked paper for an electrolyte.
His invention disproved the common theory that electricity could only be created by living beings.
Daniell Cell (1836)
About 40 years later, a British chemist named John Frederic Daniell would create a new cell that would solve the “hydrogen bubble” problem of the Voltaic pile. This previous problem, in which bubbles collected on the bottom of the zinc electrodes, limited the pile’s lifespan and uses.
The Daniell cell, invented in 1836, used a copper pot filled with copper sulfate solution, which was further immersed in an earthenware container filled with sulfuric acid and a zinc electrode.
The Daniell cell’s electrical potential became the basis unit for voltage, equal to one volt.
Lead-acid (1859)
The lead-acid battery was the first rechargeable battery, invented in 1859 by French physicist Gaston Planté.
Lead-acid batteries excel in two areas: they are very low cost, and they also can supply high surge currents.
This makes them suitable for automobile starter motors even with today’s technology, and it’s part of the reason $44.7 billion of lead-acid batteries were sold globally in 2014.
Nickel Cadmium (1899)
NiCd batteries were invented in 1899 by Waldemar Jungner in Sweden. The first ones were “wet-cells” similar to lead-acid batteries, using a liquid electrolyte.
Nickel Cadmium batteries helped pave the way for modern technology, but they are being used less and less because of cadmium’s toxicity. NiCd batteries lost 80% of their market share in the 1990s to batteries that are more familiar to us today.
Alkaline Batteries (1950s)
Popularized by brands like Duracell and Energizer, alkaline batteries are used in regular household devices from remote controls to flashlights. They are inexpensive and typically non-rechargeable, though they can be made rechargeable by using a specially designed cell.
The modern alkaline battery was invented by Canadian engineer Lewis Urry in the 1950s. Using zinc and manganese oxide in the electrodes, the battery type gets its name from the alkaline electrolyte used: potassium hydroxide.
Over 10 billion alkaline batteries have been made in the world.
Nickel-Metal Hydride (1989)
Similar to the rechargeable NiCd battery, the NiMH formulation uses a hydrogen-absorbing alloy instead of toxic cadmium. This makes it more environmentally safe – and it also helps to increase the energy density.
NiMH batteries are used in power tools, digital cameras, and some other electronic devices. They also were used in early hybrid vehicles such as the Toyota Prius.
The development of the NiMH spanned two decades, and was sponsored by Daimler-Benz and Volkswagen AG. The first commercially available cells were in 1989.
Lithium-Ion (1991)
Sony released the first commercial lithium-ion battery in 1991.
Lithium-ion batteries have high energy density and have a number of specific cathode formulations for different applications.
For example, lithium cobalt dioxide (LiCoO2) cathodes are used in laptops and smartphones, while lithium nickel cobalt aluminum oxide (LiNiCoAlO2) cathodes, also known as NCAs, are used in the batteries of vehicles such as the Tesla Model S.
Graphite is a common material for use in the anode, and the electrolyte is most often a type of lithium salt suspended in an organic solvent.
The Rechargeable Battery Spectrum
There are several factors that could affect battery choice, including cost.
However, here are two of the most important factors that determine the fit and use of rechargeable batteries specifically:
Think of specific energy as in the amount of water in a tank. It’s the amount of energy a battery holds in total.
Meanwhile, specific power is the speed at which that water can pour out of the tank. It’s the amount of current a battery can supply for a given use.
And while today the lithium-ion battery is the workhorse for gadgets and electric vehicles – what batteries will be vital to our future? How big is that market?
Find out in the rest of the Battery Series. (Parts 2 through 5 will be released throughout the summer of 2016).


Technology
Visualizing AI Patents by Country
See which countries have been granted the most AI patents each year, from 2012 to 2022.


Visualizing AI Patents by Country
This was originally posted on our Voronoi app. Download the app for free on iOS or Android and discover incredible data-driven charts from a variety of trusted sources.
This infographic shows the number of AI-related patents granted each year from 2010 to 2022 (latest data available). These figures come from the Center for Security and Emerging Technology (CSET), accessed via Stanford University’s 2024 AI Index Report.
From this data, we can see that China first overtook the U.S. in 2013. Since then, the country has seen enormous growth in the number of AI patents granted each year.
| Year | China | EU and UK | U.S. | RoW | Global Total |
|---|---|---|---|---|---|
| 2010 | 307 | 137 | 984 | 571 | 1,999 |
| 2011 | 516 | 129 | 980 | 581 | 2,206 |
| 2012 | 926 | 112 | 950 | 660 | 2,648 |
| 2013 | 1,035 | 91 | 970 | 627 | 2,723 |
| 2014 | 1,278 | 97 | 1,078 | 667 | 3,120 |
| 2015 | 1,721 | 110 | 1,135 | 539 | 3,505 |
| 2016 | 1,621 | 128 | 1,298 | 714 | 3,761 |
| 2017 | 2,428 | 144 | 1,489 | 1,075 | 5,136 |
| 2018 | 4,741 | 155 | 1,674 | 1,574 | 8,144 |
| 2019 | 9,530 | 322 | 3,211 | 2,720 | 15,783 |
| 2020 | 13,071 | 406 | 5,441 | 4,455 | 23,373 |
| 2021 | 21,907 | 623 | 8,219 | 7,519 | 38,268 |
| 2022 | 35,315 | 1,173 | 12,077 | 13,699 | 62,264 |
In 2022, China was granted more patents than every other country combined.
While this suggests that the country is very active in researching the field of artificial intelligence, it doesn’t necessarily mean that China is the farthest in terms of capability.
Key Facts About AI Patents
According to CSET, AI patents relate to mathematical relationships and algorithms, which are considered abstract ideas under patent law. They can also have different meaning, depending on where they are filed.
In the U.S., AI patenting is concentrated amongst large companies including IBM, Microsoft, and Google. On the other hand, AI patenting in China is more distributed across government organizations, universities, and tech firms (e.g. Tencent).
In terms of focus area, China’s patents are typically related to computer vision, a field of AI that enables computers and systems to interpret visual data and inputs. Meanwhile America’s efforts are more evenly distributed across research fields.
Learn More About AI From Visual Capitalist
If you want to see more data visualizations on artificial intelligence, check out this graphic that shows which job departments will be impacted by AI the most.

-

 Markets1 week ago
U.S. Debt Interest Payments Reach $1 Trillion
-

 Business2 weeks ago
Charted: Big Four Market Share by S&P 500 Audits
-

 Real Estate2 weeks ago
Ranked: The Most Valuable Housing Markets in America
-

 Money2 weeks ago
Which States Have the Highest Minimum Wage in America?
-

 AI2 weeks ago
Ranked: Semiconductor Companies by Industry Revenue Share
-

 Markets2 weeks ago
Ranked: The World’s Top Flight Routes, by Revenue
-

 Demographics2 weeks ago
Population Projections: The World’s 6 Largest Countries in 2075
-

 Markets2 weeks ago
The Top 10 States by Real GDP Growth in 2023