Energy
Chart: Which Countries Are Damaged Most by Low Oil Prices?
Which Countries Are Damaged Most by Low Oil Prices?
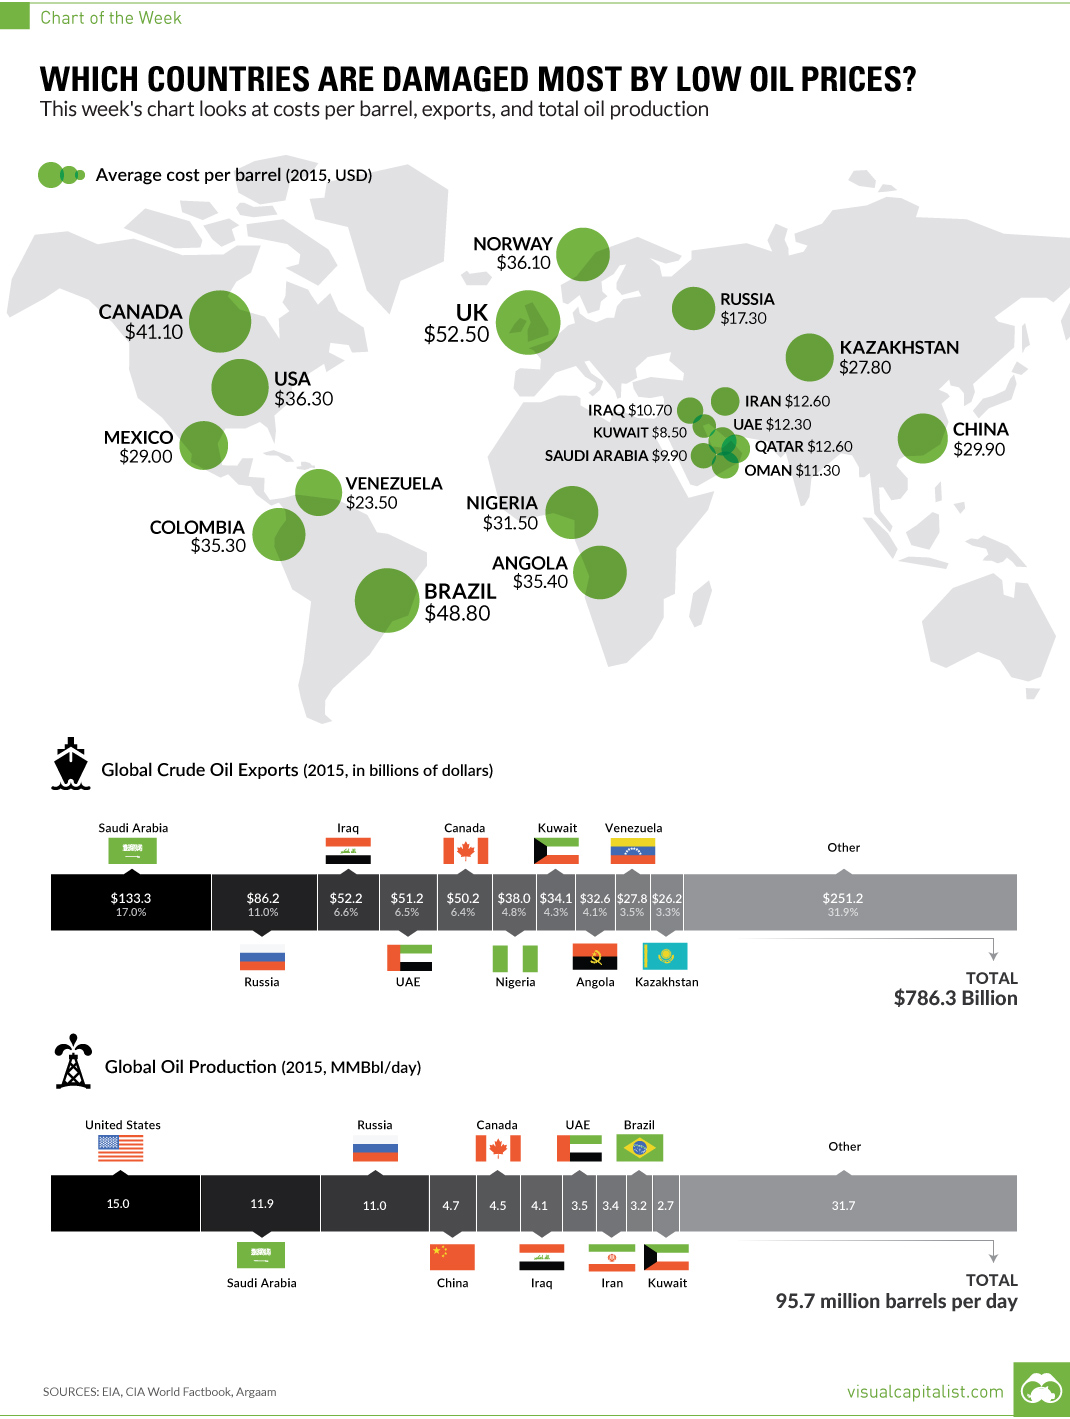
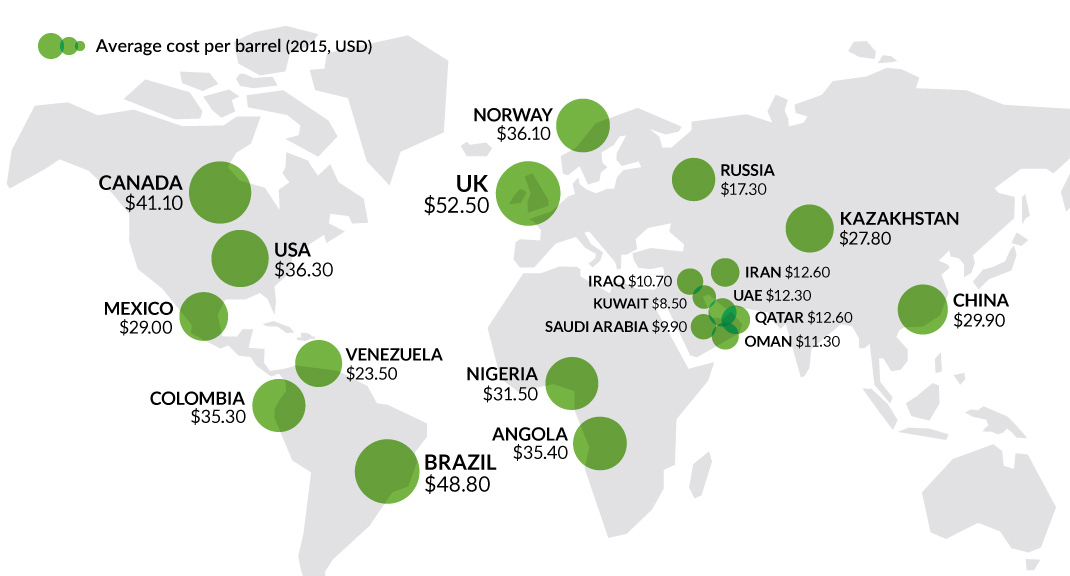
This week’s chart looks at costs per barrel, exports, and total oil production.
The Chart of the Week is a weekly Visual Capitalist feature on Fridays.
Oil is by far the world’s most-traded commodity, with $786.3 billion of crude changing hands in international trade in 2015.
While low commodity prices can hurt any major producer, oil prices can have a particularly detrimental effect on oil-rich economies. This is because, for better or worse, many of these economies hold onto oil as an anchor for achieving growth, filling government coffers, and even fueling social programs.
If those revenues don’t materialize as planned, these countries turn increasingly fragile. In the worst case scenario, an extended period of low oil prices can cause the fate of an entire regime to hang by a thread.
Which Countries are Damaged Most by Low Oil Prices?
This week’s chart explores three key pieces of high-level data on the oil sector from 2015: the cost of production ($/bbl), total oil production (MMbbl/day), and the world’s top exporters of oil ($).
The general effects of these factors are pretty straightforward:
- Countries that have a high cost of production per barrel are going to find it tough to make money in a low oil price environment
- Countries that are major producers or exporters tend to rely on oil revenues as a major economic driver
- Oil producers that are major exporters also have to deal with another factor: the effect that low oil prices may have on their currencies
Here are some particular countries that are under duress from current energy prices:
Venezuela
Back in the Hugo Chávez era, things were better in Venezuela than they are today. Oil prices were mostly sky-high, and this enabled the socialist country to bring down inequality as well as put food on the table for its citizens. However, as the World Bank described in 2012, since oil accounted for “96% of the country’s exports and nearly half of its fiscal revenue”, Venezuela was left “extremely vulnerable” to changes in oil prices.
And change they did. Oil prices are now less than 50% of what they were when the World Bank wrote the above commentary. Partially as a result, Venezuela is having all sorts of problems, ranging from runaway hyperinflation to shortages in almost everything.
Venezuela’s cost per barrel isn’t bad at $23.50, but the country is the world’s ninth-largest oil exporter with $27.8 billion of exports in 2015. If oil prices were north of $100/bbl, Venezuela’s situation would be a lot less dire.
Russia
Russia is the world’s second-largest crude oil exporter, shipping $86.2 billion to countries outside of its borders in 2015. That’s good for 11.0% of all oil exports globally. Russia’s cost of production in 2015 was relatively low, at $17.30 per barrel.
But is declining oil revenue influencing foreign policy? It’s hard to say – but we do know that, historically, leaders have turned to nationalist projects during tougher economic times. In this case, Putin may have focused Russia’s national attention on Ukraine as a way to deflect from a less-than-rosy economic outlook.
Brazil
All is not well in Brazil, where President Dilma Rousseff could be impeached by as early as next week.
Brazil is the ninth-largest producer of oil globally, pumping out about 3.2 million barrels per day. However, a bigger concern may be the cost of producing oil in the country. The production cost in 2015 was a hefty $48.80/bbl, among the most expensive of major oil producers.
The post-Olympics hangover will be a challenging one in Brazil, as it faces its worst economic crisis in 30 years. The largest country in Latin America had its economy shrink 5.4% in the first quarter of this year.
Nigeria
Nigeria, which will soon be one of the three most populous countries in the world, is also very reliant on oil revenues to prop up its economy.
The country has a $7 billion budget deficit due to lower oil revenues, and it recently also dropped its peg to the U.S. dollar on June 15th. The naira fell 61% against the dollar since then, wreaking havoc throughout the economy. Nigeria also recently lost its title of “Africa’s largest economy”, handing it back to South Africa.
Nigeria is the sixth-largest exporter of oil, with annual exports of $38 billion in 2015. Its cost of production is higher than average, as well, at $31.50 per barrel.
Canada
Canada’s economy is largely diversified, but it is also the world’s fifth-largest exporter of oil with $50.2 billion of exports in 2015. Costs are also high in the oil sands, and the average cost of production per barrel was $41.10 throughout the country.
The oil bust has dragged the energy-rich province of Alberta into a recession, and the Canadian dollar is also severely impacted by oil prices for multiple reasons. Alberta’s economy is about to have its largest two-year contraction on record, while the provincial government’s deficit has exploded to $10.9 billion.
Energy investment in Alberta is forecast to be about half of the total from 2014. Meanwhile, economic conditions elsewhere have also been impacted, as areas such as housing, retail, labor markets, and manufacturing have all felt the pinch.


Energy
Charted: 4 Reasons Why Lithium Could Be the Next Gold Rush
Visual Capitalist has partnered with EnergyX to show why drops in prices and growing demand may make now the right time to invest in lithium.


4 Reasons Why You Should Invest in Lithium
Lithium’s importance in powering EVs makes it a linchpin of the clean energy transition and one of the world’s most precious minerals.
In this graphic, Visual Capitalist partnered with EnergyX to explore why now may be the time to invest in lithium.
1. Lithium Prices Have Dropped
One of the most critical aspects of evaluating an investment is ensuring that the asset’s value is higher than its price would indicate. Lithium is integral to powering EVs, and, prices have fallen fast over the last year:
| Date | LiOH·H₂O* | Li₂CO₃** |
|---|---|---|
| Feb 2023 | $76 | $71 |
| March 2023 | $71 | $61 |
| Apr 2023 | $43 | $33 |
| May 2023 | $43 | $33 |
| June 2023 | $47 | $45 |
| July 2023 | $44 | $40 |
| Aug 2023 | $35 | $35 |
| Sept 2023 | $28 | $27 |
| Oct 2023 | $24 | $23 |
| Nov 2023 | $21 | $21 |
| Dec 2023 | $17 | $16 |
| Jan 2024 | $14 | $15 |
| Feb 2024 | $13 | $14 |
Note: Monthly spot prices were taken as close to the 14th of each month as possible.
*Lithium hydroxide monohydrate MB-LI-0033
**Lithium carbonate MB-LI-0029
2. Lithium-Ion Battery Prices Are Also Falling
The drop in lithium prices is just one reason to invest in the metal. Increasing economies of scale, coupled with low commodity prices, have caused the cost of lithium-ion batteries to drop significantly as well.
In fact, BNEF reports that between 2013 and 2023, the price of a Li-ion battery dropped by 82%.
| Year | Price per KWh |
|---|---|
| 2023 | $139 |
| 2022 | $161 |
| 2021 | $150 |
| 2020 | $160 |
| 2019 | $183 |
| 2018 | $211 |
| 2017 | $258 |
| 2016 | $345 |
| 2015 | $448 |
| 2014 | $692 |
| 2013 | $780 |

3. EV Adoption is Sustainable
One of the best reasons to invest in lithium is that EVs, one of the main drivers behind the demand for lithium, have reached a price point similar to that of traditional vehicle.
According to the Kelly Blue Book, Tesla’s average transaction price dropped by 25% between 2022 and 2023, bringing it in line with many other major manufacturers and showing that EVs are a realistic transport option from a consumer price perspective.
| Manufacturer | September 2022 | September 2023 |
|---|---|---|
| BMW | $69,000 | $72,000 |
| Ford | $54,000 | $56,000 |
| Volkswagon | $54,000 | $56,000 |
| General Motors | $52,000 | $53,000 |
| Tesla | $68,000 | $51,000 |
4. Electricity Demand in Transport is Growing
As EVs become an accessible transport option, there’s an investment opportunity in lithium. But possibly the best reason to invest in lithium is that the IEA reports global demand for the electricity in transport could grow dramatically by 2030:
| Transport Type | 2022 | 2025 | 2030 |
|---|---|---|---|
| Buses 🚌 | 23,000 GWh | 50,000 GWh | 130,000 GWh |
| Cars 🚙 | 65,000 GWh | 200,000 GWh | 570,000 GWh |
| Trucks 🛻 | 4,000 GWh | 15,000 GWh | 94,000 GWh |
| Vans 🚐 | 6,000 GWh | 16,000 GWh | 72,000 GWh |
The Lithium Investment Opportunity
Lithium presents a potentially classic investment opportunity. Lithium and battery prices have dropped significantly, and recently, EVs have reached a price point similar to other vehicles. By 2030, the demand for clean energy, especially in transport, will grow dramatically.
With prices dropping and demand skyrocketing, now is the time to invest in lithium.
EnergyX is poised to exploit lithium demand with cutting-edge lithium extraction technology capable of extracting 300% more lithium than current processes.

-

 Lithium3 days ago
Ranked: The Top 10 EV Battery Manufacturers in 2023
Asia dominates this ranking of the world’s largest EV battery manufacturers in 2023.
-

 Energy1 week ago
The World’s Biggest Nuclear Energy Producers
China has grown its nuclear capacity over the last decade, now ranking second on the list of top nuclear energy producers.
-

 Energy4 weeks ago
The World’s Biggest Oil Producers in 2023
Just three countries accounted for 40% of global oil production last year.
-

 Energy1 month ago
How Much Does the U.S. Depend on Russian Uranium?
Currently, Russia is the largest foreign supplier of nuclear power fuel to the U.S.
-

 Uranium2 months ago
Charted: Global Uranium Reserves, by Country
We visualize the distribution of the world’s uranium reserves by country, with 3 countries accounting for more than half of total reserves.
-

 Energy3 months ago
Visualizing the Rise of the U.S. as Top Crude Oil Producer
Over the last decade, the United States has established itself as the world’s top producer of crude oil, surpassing Saudi Arabia and Russia.

-

 Mining1 week ago
Gold vs. S&P 500: Which Has Grown More Over Five Years?
-

 Markets2 weeks ago
Ranked: The Most Valuable Housing Markets in America
-

 Money2 weeks ago
Which States Have the Highest Minimum Wage in America?
-

 AI2 weeks ago
Ranked: Semiconductor Companies by Industry Revenue Share
-

 Markets2 weeks ago
Ranked: The World’s Top Flight Routes, by Revenue
-

 Countries2 weeks ago
Population Projections: The World’s 6 Largest Countries in 2075
-

 Markets2 weeks ago
The Top 10 States by Real GDP Growth in 2023
-

 Demographics2 weeks ago
The Smallest Gender Wage Gaps in OECD Countries