Investor Education
Video: How the Economic Machine Works, According to Ray Dalio
Ray Dalio has reached the part of his life where he is giving back.
Dalio founded Bridgewater Associates out of his apartment in 1975, and now the long-running hedge fund is recognized as the world’s largest by assets under management (AUM) with $122.2 billion, and as the fifth most important private company in the United States by Fortune magazine.
However, since 2011, the billionaire has passed the baton for the role of CEO at Bridgewater – and he’s also been focused on passing on his knowledge as well.
The Knowledge Baton
Most recently, Ray Dalio has been praised for releasing his book entitled Principles: Life and Work, where he outlines the principles that have guided his impressive success with Bridgewater.
Just as timeless, however, is this 30 minute animated video that he and Bridgewater released a few years ago, which gives their unique template for how the global economy works. It’s possible that you may have seen this before – but if not, it can be a useful tool to understand how the pieces fit together.
Dalio starts at the micro level, showing how individual transactions are part of the overall economic machine.
Then, using human nature and history as a guide, Dalio reduces the complex global economy down to just three major forces that must be understood.
Three Major Forces
Dalio says this model has guided Bridgewater for over 30 years, and that there are three major forces that shape the economy:
1. Productivity Growth
Productivity growth, which is measured as a percentage of GDP, grows over time as knowledge, technology, and innovations help to raise our productivity and living standards.
2. Short-Term Debt Cycle
Usually lasting 5-8 years, the short-term debt cycle is a repeating pattern that occurs as credit expands and contracts.
3. Long-Term Debt Cycle
Usually lasting 75-100 years, the long-term debt cycle usually ends in a period of extreme deleveraging, where global debt is unsustainable and asset prices fall.
Based on Dalio’s model and his concerns about the abuse of money printing by central banks, it’s clear why he routinely holds gold for about 5-10% of his personal portfolio, as well.
Rules of Thumb
The video ends with Dalio giving three rules of thumb – takeaways that make sense for individuals, companies, and policymakers.
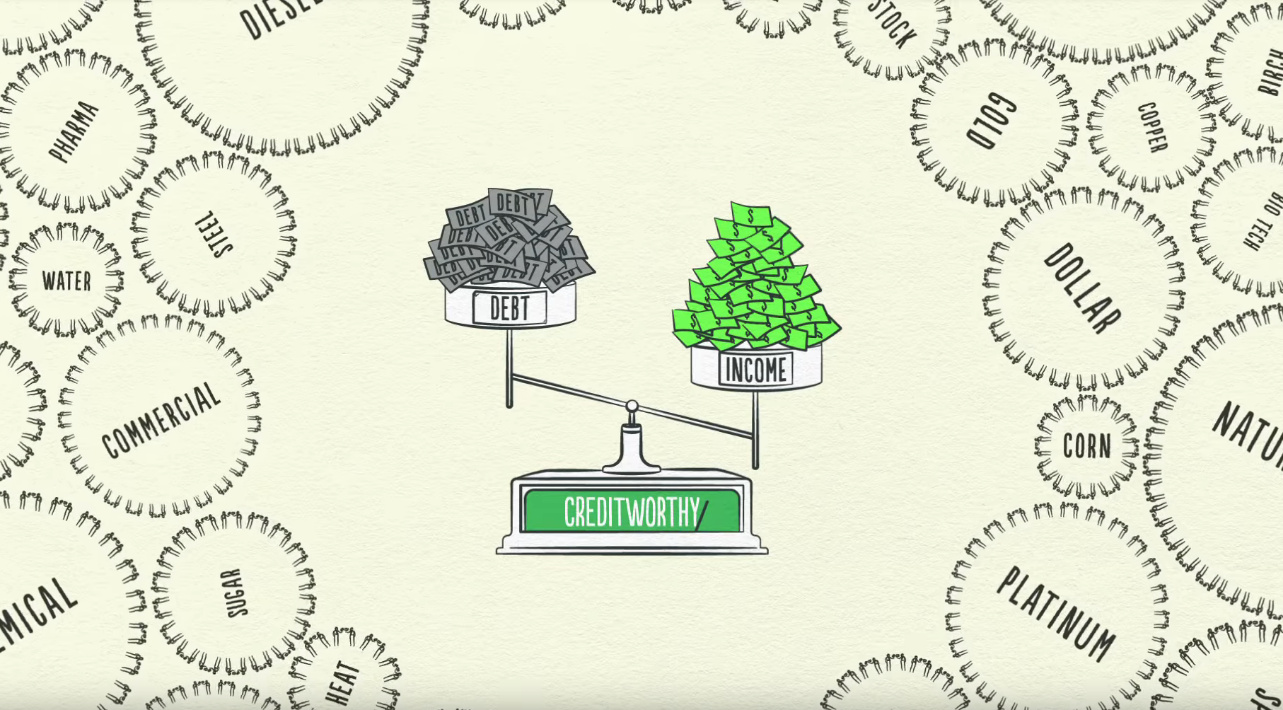
Rule #1. Don’t have debt rise faster than income
Your debt burdens will eventually crush you.
Rule #2. Don’t have income rise faster than productivity
You’ll eventually become uncompetitive.
Rule #3. Do all that you can to raise productivity
In the long run, that’s what matters the most.
With an estimated net worth of $17 billion, it seems Dalio’s rules could be worth keeping in mind.


Investor Education
How MSCI Builds Thematic Indexes: A Step-by-Step Guide
From developing an index objective to choosing relevant stocks, this graphic breaks down how MSCI builds thematic indexes using examples.


How MSCI Builds Thematic Indexes: A Step-by-Step Guide
Have you ever wondered how MSCI builds its thematic indexes?
To capture long-term, structural trends that could drive business performance in the future, the company follows a systematic approach. This graphic from MSCI breaks down each step in the process used to create its thematic indexes.
Step 1: Develop an Index Objective
MSCI first builds a broad statement of what the theme aims to capture based on extensive research and insights from industry experts.
Steps 2 and 3: List Sub-Themes, Generate Keyword List
Together with experts, MSCI creates a list of sub-themes or “seedwords” to identify aligned business activities.
The team then assembles a collection of suitable documents describing the theme. Natural language processing efficiently analyzes word frequency and relevance to generate a more detailed set of keywords contextually similar to the seedwords.
Step 4: Find Relevant Companies
By analyzing financial reports, MSCI picks companies relevant to the theme using two methods:
- Direct approach: Revenue from a company’s business segment is considered 100% relevant if the segment name matches a theme keyword. Standard Industrial Classification (SIC) codes from these directly-matched segments make up the eligible SIC code list used in the indirect approach.
- Indirect approach: If a segment name doesn’t match theme keywords, MSCI will:
- Analyze the density of theme keywords mentioned in the company’s description. A minimum of two unique keywords is required.
- The keyword density determines a “discount factor” to reflect lower certainty in theme alignment.
- Revenue from business segments with an eligible SIC code, regardless of how they are named, is scaled down by the discount factor.
The total percentage of revenue applicable to the theme from both approaches determines a company’s relevance score.
Step 5: Select the Stocks
Finally, MSCI narrows down the stocks that will be included:
- Global parent universe: The ACWI Investable Market Index (IMI) is the starting point for standard thematic indexes.
- Relevance filter: The universe is filtered for companies with a relevance score of at least 25%.
- False positive control: Eligible companies that are mapped to un-related GICS sub-industries are removed.
Companies with higher relevance scores and market caps have a higher weighting in the index, with the maximum weighting for any one issuer capped at 5%. The final selected stocks span various sectors.
MSCI Thematic Indexes: Regularly Updated and Rules-Based
Once an index is built, it is reviewed semi-annually and updated based on:
- Changes to the parent index
- Changes at individual companies
- Theme developments based on expert input
Theme keywords are reviewed yearly in May. Overall, MSCI’s thematic index construction process is objective, scalable, and flexible. The process can be customized based on the theme(s) you want to capture.
Learn more about MSCI’s thematic indexes.

-

 Investor Education6 months ago
The 20 Most Common Investing Mistakes, in One Chart
Here are the most common investing mistakes to avoid, from emotionally-driven investing to paying too much in fees.
-

 Stocks10 months ago
Visualizing BlackRock’s Top Equity Holdings
BlackRock is the world’s largest asset manager, with over $9 trillion in holdings. Here are the company’s top equity holdings.
-

 Investor Education11 months ago
10-Year Annualized Forecasts for Major Asset Classes
This infographic visualizes 10-year annualized forecasts for both equities and fixed income using data from Vanguard.
-

 Investor Education1 year ago
Visualizing 90 Years of Stock and Bond Portfolio Performance
How have investment returns for different portfolio allocations of stocks and bonds compared over the last 90 years?
-

 Debt2 years ago
Countries with the Highest Default Risk in 2022
In this infographic, we examine new data that ranks the top 25 countries by their default risk.
-

 Markets2 years ago
The Best Months for Stock Market Gains
This infographic analyzes over 30 years of stock market performance to identify the best and worst months for gains.


-

 Mining1 week ago
Gold vs. S&P 500: Which Has Grown More Over Five Years?
-

 Markets2 weeks ago
Ranked: The Most Valuable Housing Markets in America
-

 Money2 weeks ago
Which States Have the Highest Minimum Wage in America?
-

 AI2 weeks ago
Ranked: Semiconductor Companies by Industry Revenue Share
-

 Markets2 weeks ago
Ranked: The World’s Top Flight Routes, by Revenue
-

 Countries2 weeks ago
Population Projections: The World’s 6 Largest Countries in 2075
-

 Markets2 weeks ago
The Top 10 States by Real GDP Growth in 2023
-

 Demographics2 weeks ago
The Smallest Gender Wage Gaps in OECD Countries