Markets
The 10 Companies That Dominate the Global Arms Trade
The 10 Companies That Dominate the Global Arms Trade
The Chart of the Week is a weekly Visual Capitalist feature on Fridays.
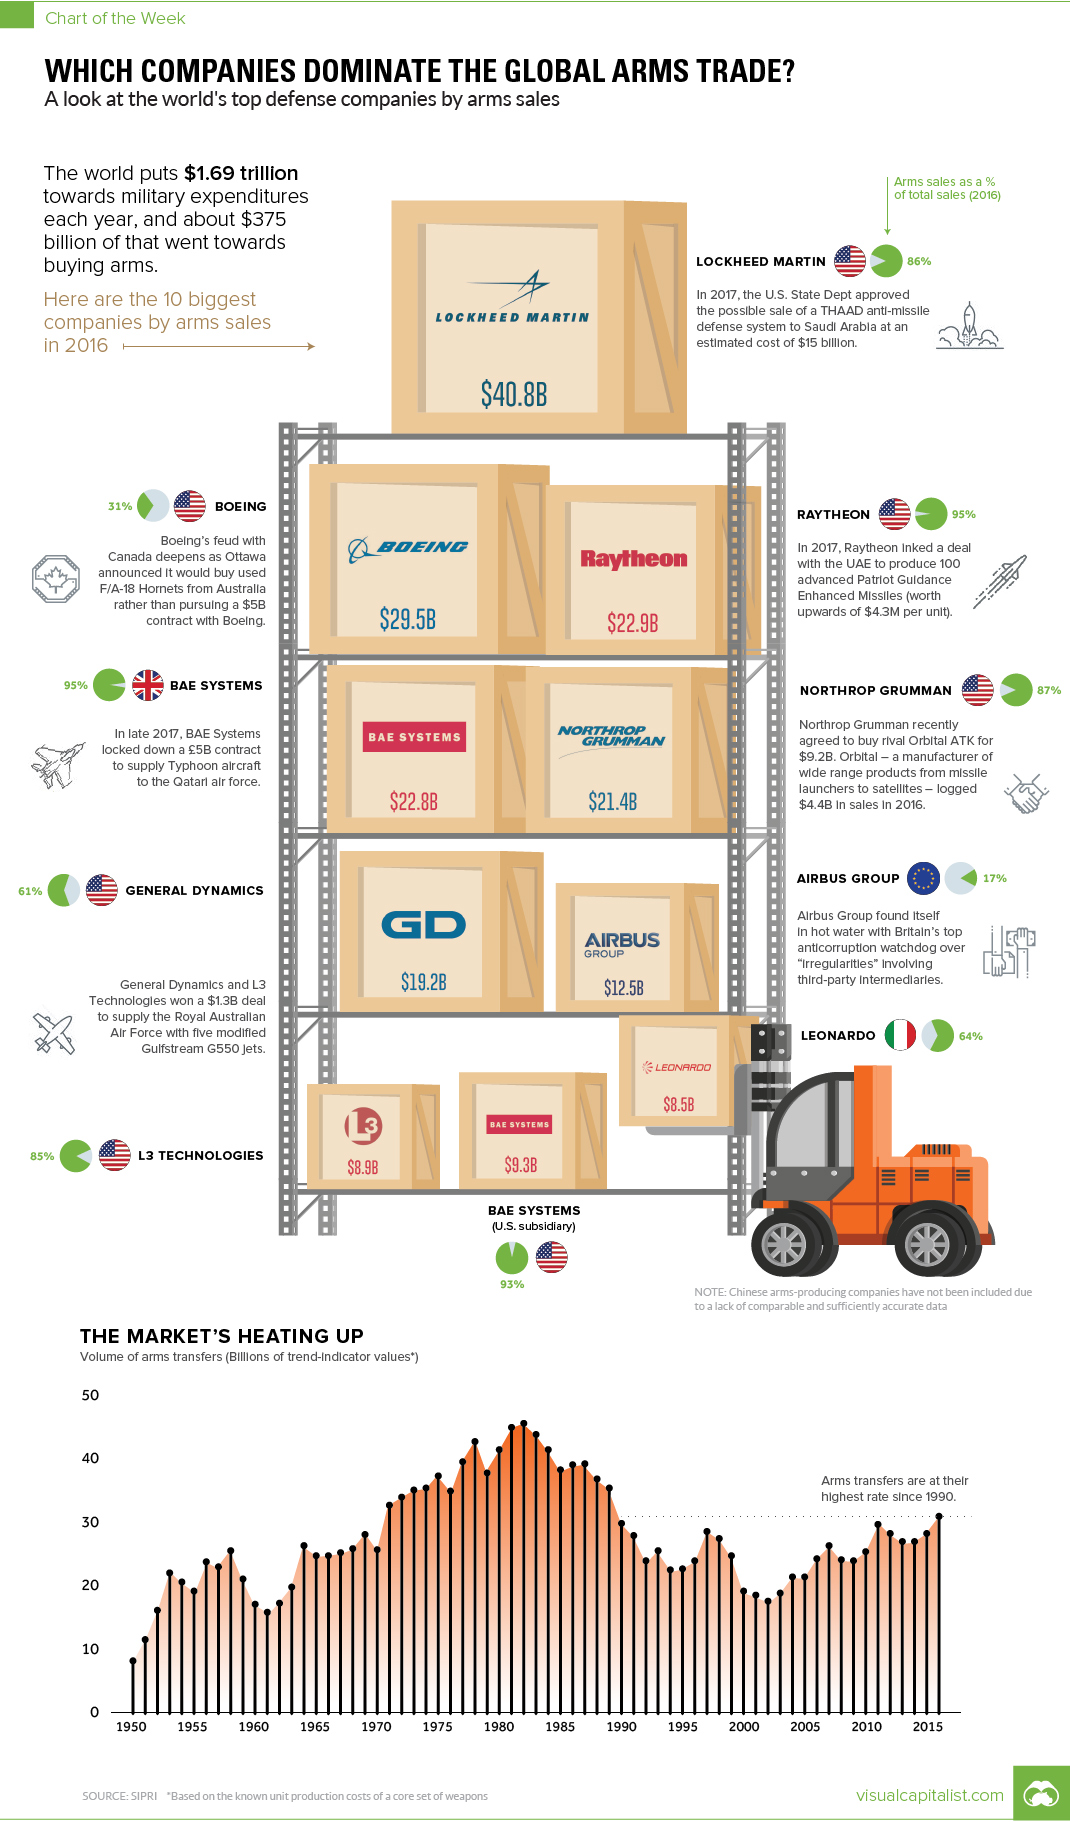
The world puts $1.69 trillion towards military expenditures per year, and about $375 billion of that goes towards buying arms specifically.
Whether it is guns, tanks, jets, missiles, or ships that are on your shopping list, in the international arms community, there is a supplier for any weapon your country desires.
Arms dealers, by sales
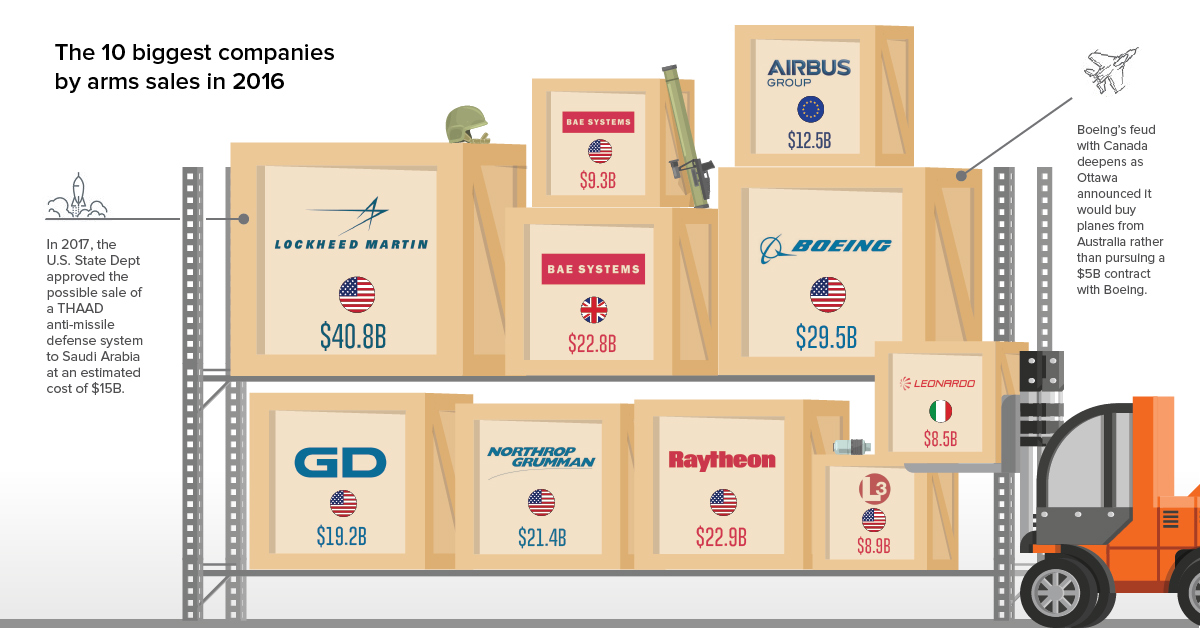
Today’s chart organizes the world’s top arms companies by sales, location, and arms as a percentage of sales:
| Rank | Company | Country | Arms sales (2016) | Arms as % of sales |
|---|---|---|---|---|
| #1 | Lockheed Martin | USA | $40.8B | 86% |
| #2 | Boeing | USA | $29.5B | 31% |
| #3 | Raytheon | USA | $22.9B | 95% |
| #4 | BAE Systems | UK | $22.8B | 95% |
| #5 | Northrop Grumman | USA | $21.4B | 87% |
| #6 | General Dynamics | USA | $19.2B | 61% |
| #7 | Airbus Group | EU | $12.5B | 17% |
| #8 | BAE Systems (U.S.) | USA | $9.3B | 93% |
| #9 | L3 Technologies | USA | $8.9B | 85% |
| #10 | Leonardo | Italy | $8.5B | 64% |
Note: Airbus considers itself a European company. It’s registered in the Netherlands, and its main HQ is in France.
The above data comes courtesy of the Stockholm International Peace Research Institute (SIPRI), which tracks arms deals and companies extensively.
USA, USA!
While it is common knowledge that the United States plays a big role in the global arms trade, the numbers are still quite astounding.
Of the top ten companies by sales, firms based in the U.S. make up seven of them. That includes the clear #1, Lockheed Martin, which had $40.8 billion in arms-related sales in 2016, as well as the remaining constituents of the top three: Boeing and Raytheon.
Further, on SIPRI’s wider top 100 list, a good proxy for total arms sales globally, U.S. defense companies accounted for a whopping 58% of total global arms sales. That adds up to $217.2 billion in 2016, a 4.0% rise over the previous year.
Rounding Out the Top 10
Only three companies make the top 10 leaderboard from outside of the United States.
That group includes Airbus, the massive European commercial airline manufacturer that gets 17% of its sales from arms-related deals, as well as BAE Systems (U.K.) and Leonardo (Italy).
As a final caveat, it’s worth mentioning that SIPRI notes that some Chinese companies would likely make its Top 100 list as well – but for now, the list excludes Chinese companies as the available data is not comparable or accurate.


Markets
U.S. Debt Interest Payments Reach $1 Trillion
U.S. debt interest payments have surged past the $1 trillion dollar mark, amid high interest rates and an ever-expanding debt burden.


U.S. Debt Interest Payments Reach $1 Trillion
This was originally posted on our Voronoi app. Download the app for free on iOS or Android and discover incredible data-driven charts from a variety of trusted sources.
The cost of paying for America’s national debt crossed the $1 trillion dollar mark in 2023, driven by high interest rates and a record $34 trillion mountain of debt.
Over the last decade, U.S. debt interest payments have more than doubled amid vast government spending during the pandemic crisis. As debt payments continue to soar, the Congressional Budget Office (CBO) reported that debt servicing costs surpassed defense spending for the first time ever this year.
This graphic shows the sharp rise in U.S. debt payments, based on data from the Federal Reserve.
A $1 Trillion Interest Bill, and Growing
Below, we show how U.S. debt interest payments have risen at a faster pace than at another time in modern history:
| Date | Interest Payments | U.S. National Debt |
|---|---|---|
| 2023 | $1.0T | $34.0T |
| 2022 | $830B | $31.4T |
| 2021 | $612B | $29.6T |
| 2020 | $518B | $27.7T |
| 2019 | $564B | $23.2T |
| 2018 | $571B | $22.0T |
| 2017 | $493B | $20.5T |
| 2016 | $460B | $20.0T |
| 2015 | $435B | $18.9T |
| 2014 | $442B | $18.1T |
| 2013 | $425B | $17.2T |
| 2012 | $417B | $16.4T |
| 2011 | $433B | $15.2T |
| 2010 | $400B | $14.0T |
| 2009 | $354B | $12.3T |
| 2008 | $380B | $10.7T |
| 2007 | $414B | $9.2T |
| 2006 | $387B | $8.7T |
| 2005 | $355B | $8.2T |
| 2004 | $318B | $7.6T |
| 2003 | $294B | $7.0T |
| 2002 | $298B | $6.4T |
| 2001 | $318B | $5.9T |
| 2000 | $353B | $5.7T |
| 1999 | $353B | $5.8T |
| 1998 | $360B | $5.6T |
| 1997 | $368B | $5.5T |
| 1996 | $362B | $5.3T |
| 1995 | $357B | $5.0T |
| 1994 | $334B | $4.8T |
| 1993 | $311B | $4.5T |
| 1992 | $306B | $4.2T |
| 1991 | $308B | $3.8T |
| 1990 | $298B | $3.4T |
| 1989 | $275B | $3.0T |
| 1988 | $254B | $2.7T |
| 1987 | $240B | $2.4T |
| 1986 | $225B | $2.2T |
| 1985 | $219B | $1.9T |
| 1984 | $205B | $1.7T |
| 1983 | $176B | $1.4T |
| 1982 | $157B | $1.2T |
| 1981 | $142B | $1.0T |
| 1980 | $113B | $930.2B |
| 1979 | $96B | $845.1B |
| 1978 | $84B | $789.2B |
| 1977 | $69B | $718.9B |
| 1976 | $61B | $653.5B |
| 1975 | $55B | $576.6B |
| 1974 | $50B | $492.7B |
| 1973 | $45B | $469.1B |
| 1972 | $39B | $448.5B |
| 1971 | $36B | $424.1B |
| 1970 | $35B | $389.2B |
| 1969 | $30B | $368.2B |
| 1968 | $25B | $358.0B |
| 1967 | $23B | $344.7B |
| 1966 | $21B | $329.3B |
Interest payments represent seasonally adjusted annual rate at the end of Q4.
At current rates, the U.S. national debt is growing by a remarkable $1 trillion about every 100 days, equal to roughly $3.6 trillion per year.
As the national debt has ballooned, debt payments even exceeded Medicaid outlays in 2023—one of the government’s largest expenditures. On average, the U.S. spent more than $2 billion per day on interest costs last year. Going further, the U.S. government is projected to spend a historic $12.4 trillion on interest payments over the next decade, averaging about $37,100 per American.
Exacerbating matters is that the U.S. is running a steep deficit, which stood at $1.1 trillion for the first six months of fiscal 2024. This has accelerated due to the 43% increase in debt servicing costs along with a $31 billion dollar increase in defense spending from a year earlier. Additionally, a $30 billion increase in funding for the Federal Deposit Insurance Corporation in light of the regional banking crisis last year was a major contributor to the deficit increase.
Overall, the CBO forecasts that roughly 75% of the federal deficit’s increase will be due to interest costs by 2034.

-

 Mining2 weeks ago
Charted: The Value Gap Between the Gold Price and Gold Miners
-

 Real Estate1 week ago
Ranked: The Most Valuable Housing Markets in America
-

 Business1 week ago
Charted: Big Four Market Share by S&P 500 Audits
-

 AI1 week ago
The Stock Performance of U.S. Chipmakers So Far in 2024
-

 Misc1 week ago
Almost Every EV Stock is Down After Q1 2024
-

 Money2 weeks ago
Where Does One U.S. Tax Dollar Go?
-

 Green2 weeks ago
Ranked: Top Countries by Total Forest Loss Since 2001
-

 Real Estate2 weeks ago
Visualizing America’s Shortage of Affordable Homes