Politics
What is the World’s Most Powerful Passport?
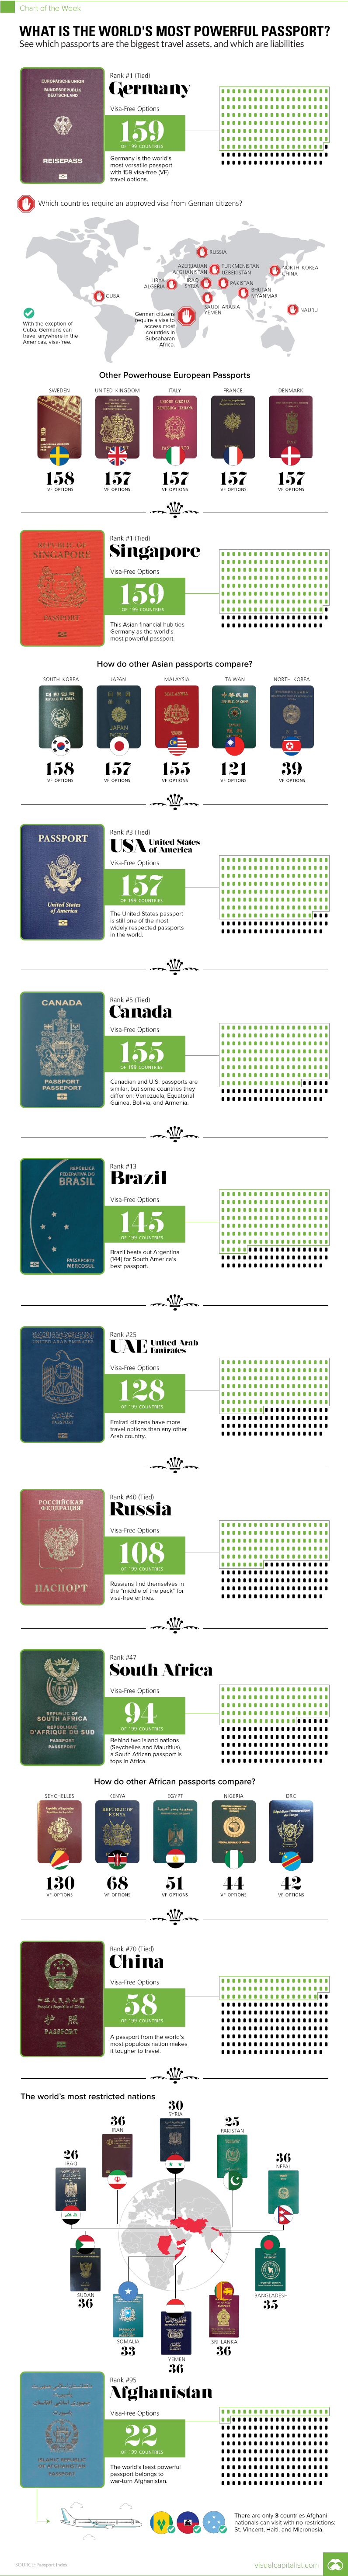
The World’s Most Powerful Passports
Which passports are travel assets, and which are liabilities?
The Chart of the Week is a weekly Visual Capitalist feature on Fridays.
Whether you seek to explore distant lands, or you just want to sit on a remote island beach with a margarita, your passport can be your biggest travel asset. The right document grants you visa-free access to over 150+ countries, and makes applying for entry to the other places a short and easy afterthought.
But a passport can also be your biggest liability. Having a passport from the wrong place means travel is extremely restricted to just a few countries – and these are generally not the places travelers want to go, anyways.
Even worse, passports on the lower end of the spectrum are also heavily scrutinized at entry-points around the world. If you have a document from Afghanistan, Sri Lanka, Lebanon, or several other countries, there may be many hoops for you to jump through to get to your final destination.
The Most Powerful Passport
According to the Passport Index, the distinction for the world’s most powerful passport actually ends up as a tie between Germany and Singapore. Both have unparalleled access to visa-free entries, each with a list of 159 countries that citizens can go to without any hassles.
Like Germany, most other Western European nations do similarly well in the visa-free department:
| Global Passport Rank | Country | Number of Countries (Visa-Free) |
|---|---|---|
| #1 (tie) | Germany | 159 |
| #2 (tie) | Sweden | 158 |
| #3 (tie) | Denmark | 157 |
| #3 (tie) | Finland | 157 |
| #3 (tie) | Italy | 157 |
| #3 (tie) | France | 157 |
| #3 (tie) | Spain | 157 |
| #3 (tie) | Norway | 157 |
| #3 (tie) | United Kingdom | 157 |
In Asia, however, things are quite different. After Singapore and a few other countries (Japan, South Korea, and Malaysia), things drop off faster.
| Global Passport Rank | Country | Number of Countries (Visa-Free) |
|---|---|---|
| #1 (tie) | Singapore | 159 |
| #2 (tie) | South Korea | 158 |
| #3 (tie) | Japan | 157 |
| #5 (tie) | Malaysia | 155 |
| #16 | Hong Kong | 142 |
| #18 | Israel | 138 |
| #19 (tie) | Brunei | 136 |
| #24 | UAE | 128 |
| #30 | Taiwan | 121 |
Further down the list in Asia, citizens of certain countries find themselves in even a tougher place, especially if they reside in the Middle East. Countries like Afghanistan (22), Pakistan (25), Iraq (26), Syria (30), and Bangladesh (35) have some of the shortest lists of visa-free countries that citizens have access to.
North America
In North America, the United States and Canada both have powerful passports with 157 and 155 visa-free options respectively.
However, they differ in a few key areas. Americans have visa-free access to Armenia, Equatorial Guinea, Palau, the Marshall Islands, and the Central African Republic, while Canadians have visa-free access to Bolivia, Venezuela, and Gambia.
Don’t Own These Passports…
We alluded earlier to the fact that a passport can also be a traveler’s biggest liability.
Here are some of the countries that you would likely not want to have a passport from:
| Global Passport Rank | Country | Number of Countries (Visa-Free) |
|---|---|---|
| #89 (tie) | Sri Lanka | 36 |
| #89 (tie) | Nepal | 36 |
| #89 (tie) | Iran | 36 |
| #89 (tie) | Yemen | 36 |
| #89 (tie) | Sudan | 36 |
| #90 | Bangladesh | 35 |
| #91 | Somalia | 33 |
| #92 | Syria | 30 |
| #93 | Iraq | 26 |
| #94 | Pakistan | 25 |
| #95 | Afghanistan | 22 |


Economy
The Bloc Effect: International Trade with Geopolitical Allies on the Rise
Rising geopolitical tensions are shaping the future of international trade, but what is the effect on trading among G7 and BRICS countries?


The Bloc Effect: International Trade with Allies on the Rise
International trade has become increasingly fragmented over the last five years as countries have shifted to trading more with their geopolitical allies.
This graphic from The Hinrich Foundation, the first in a three-part series covering the future of trade, provides visual context to the growing divide in trade in G7 and pre-expansion BRICS countries, which are used as proxies for geopolitical blocs.
Trade Shifts in G7 and BRICS Countries
This analysis uses IMF data to examine differences in shares of exports within and between trading blocs from 2018 to 2023. For example, we looked at the percentage of China’s exports with other BRICS members as well as with G7 members to see how these proportions shifted in percentage points (pp) over time.
Countries traded nearly $270 billion more with allies in 2023 compared to 2018. This shift came at the expense of trade with rival blocs, which saw a decline of $314 billion.
Country Change in Exports Within Bloc (pp) Change in Exports With Other Bloc (pp)
🇮🇳 India 0.0 3.9
🇷🇺 Russia 0.7 -3.8
🇮🇹 Italy 0.8 -0.7
🇨🇦 Canada 0.9 -0.7
🇫🇷 France 1.0 -1.1
🇪🇺 EU 1.1 -1.5
🇩🇪 Germany 1.4 -2.1
🇿🇦 South Africa 1.5 1.5
🇺🇸 U.S. 1.6 -0.4
🇯🇵 Japan 2.0 -1.7
🇨🇳 China 2.1 -5.2
🇧🇷 Brazil 3.7 -3.3
🇬🇧 UK 10.2 0.5
All shifts reported are in percentage points. For example, the EU saw its share of exports to G7 countries rise from 74.3% in 2018 to 75.4% in 2023, which equates to a 1.1 percentage point increase.
The UK saw the largest uptick in trading with other countries within the G7 (+10.2 percentage points), namely the EU, as the post-Brexit trade slump to the region recovered.
Meanwhile, the U.S.-China trade dispute caused China’s share of exports to the G7 to fall by 5.2 percentage points from 2018 to 2023, the largest decline in our sample set. In fact, partly as a result of the conflict, the U.S. has by far the highest number of harmful tariffs in place.
The Russia-Ukraine War and ensuing sanctions by the West contributed to Russia’s share of exports to the G7 falling by 3.8 percentage points over the same timeframe.
India, South Africa, and the UK bucked the trend and continued to witness advances in exports with the opposing bloc.
Average Trade Shifts of G7 and BRICS Blocs
Though results varied significantly on a country-by-country basis, the broader trend towards favoring geopolitical allies in international trade is clear.
Bloc Change in Exports Within Bloc (pp) Change in Exports With Other Bloc (pp)
Average 2.1 -1.1
BRICS 1.6 -1.4
G7 incl. EU 2.4 -1.0
Overall, BRICS countries saw a larger shift away from exports with the other bloc, while for G7 countries the shift within their own bloc was more pronounced. This implies that though BRICS countries are trading less with the G7, they are relying more on trade partners outside their bloc to make up for the lost G7 share.
A Global Shift in International Trade and Geopolitical Proximity
The movement towards strengthening trade relations based on geopolitical proximity is a global trend.
The United Nations categorizes countries along a scale of geopolitical proximity based on UN voting records.
According to the organization’s analysis, international trade between geopolitically close countries rose from the first quarter of 2022 (when Russia first invaded Ukraine) to the third quarter of 2023 by over 6%. Conversely, trade with geopolitically distant countries declined.
The second piece in this series will explore China’s gradual move away from using the U.S. dollar in trade settlements.
Visit the Hinrich Foundation to learn more about the future of geopolitical trade

-

 Economy2 days ago
Economic Growth Forecasts for G7 and BRICS Countries in 2024
The IMF has released its economic growth forecasts for 2024. How do the G7 and BRICS countries compare?
-

 United States2 weeks ago
Ranked: The Largest U.S. Corporations by Number of Employees
We visualized the top U.S. companies by employees, revealing the massive scale of retailers like Walmart, Target, and Home Depot.
-

 Economy2 weeks ago
Where U.S. Inflation Hit the Hardest in March 2024
We visualized product categories that saw the highest % increase in price due to U.S. inflation as of March 2024.
-

 Economy1 month ago
G20 Inflation Rates: Feb 2024 vs COVID Peak
We visualize inflation rates across G20 countries as of Feb 2024, in the context of their COVID-19 pandemic peak.
-

 Economy1 month ago
Mapped: Unemployment Claims by State
This visual heatmap of unemployment claims by state highlights New York, California, and Alaska leading the country by a wide margin.
-

 Economy2 months ago
Confidence in the Global Economy, by Country
Will the global economy be stronger in 2024 than in 2023?


-

 Debt1 week ago
How Debt-to-GDP Ratios Have Changed Since 2000
-

 Markets2 weeks ago
Ranked: The World’s Top Flight Routes, by Revenue
-

 Demographics2 weeks ago
Population Projections: The World’s 6 Largest Countries in 2075
-

 Markets2 weeks ago
The Top 10 States by Real GDP Growth in 2023
-

 Demographics2 weeks ago
The Smallest Gender Wage Gaps in OECD Countries
-
Economy2 weeks ago
Where U.S. Inflation Hit the Hardest in March 2024
-

 Green2 weeks ago
Top Countries By Forest Growth Since 2001
-
United States2 weeks ago
Ranked: The Largest U.S. Corporations by Number of Employees