Technology
Chart: Fintech is in the Eye of the Beholder
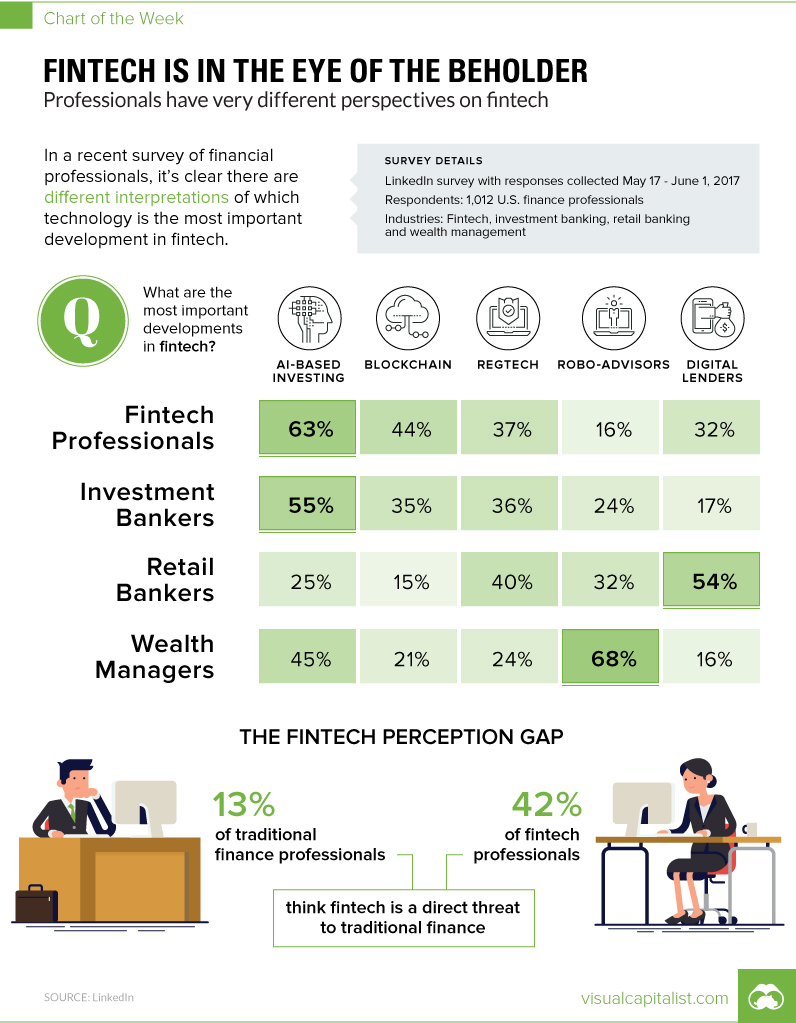
Fintech is in the Eye of the Beholder
Finance professionals have very different perspectives
The Chart of the Week is a weekly Visual Capitalist feature on Fridays.
The development of new technology in the financial sector is happening at a breakneck speed.
Between the emergence of the blockchain, AI, robo-advisors, regtech, payment and loan services, and many other examples of technological progress, there are many ideas to keep track of at once.
It would appear that these changes are happening so fast, in fact, that people don’t even have a uniform idea of what fintech really is.
Varying Interpretations
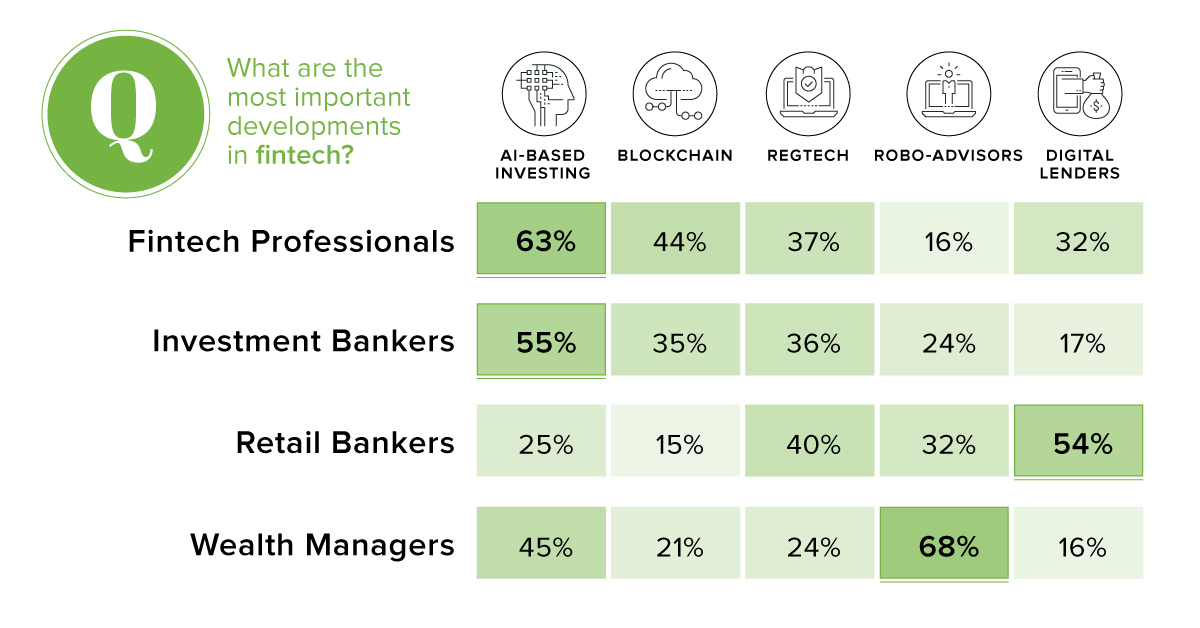
According to the results of LinkedIn’s survey of financial services professionals, how fintech is perceived greatly depends on a person’s role within the financial industry.
Wealth managers, for example, are very much aware of the robo-advisor arms race happening now, and how it may impact their future business especially with millennials. As a result, it’s likely no surprise that 68% of wealth managers rank robo-advisors as an important development within the fintech sector. Meanwhile, other developments like the blockchain (21%), regtech (24%) and digital lending (16%) are perceived as less important by this group.
For investment bankers and fintech professionals, the tables are turned.
Interestingly, these two groups seem to see more eye-to-eye regarding the technologies at play in the finance sector. Both fintech professionals (63%) and investment bankers (55%) saw AI-based investing as an important development, and both saw the blockchain (44% and 35%) as a key development as well.
Blockchain, Schmlockchain
Retail bankers had a very different perspective on the blockchain. They ranked both insurtech and chatbots (which we didn’t even show in our chart) as more important than the new distributed ledger technology, putting it in last place out of the options given.
This could be an oversight, considering that cryptocurrencies alone are already worth more than $80 billion, and that doesn’t even include the many other potential applications of the blockchain.
Retail bankers had other contrarian opinions as well – they were the only subgroup where the majority chose digital lending (54%) as the most important development in the industry as a whole.
Living in Alternate Realities?
While the jury is still out on what aspect of fintech will have the biggest impact on financial services overall, there is an even deeper question at hand: will fintech make a real impact on traditional financial services at all?
It’s a question that’s very divisive, with very different answers depending on your side of the spectrum:
- 42% of fintech professionals see fintech as being a direct threat to traditional finance
- 13% of traditional finance professionals see fintech as being a direct threat to traditional finance
Who’s right, and who’s wrong?
Surely, at least one group is going to end up disappointed with their lack of foresight.


Brands
How Tech Logos Have Evolved Over Time
From complete overhauls to more subtle tweaks, these tech logos have had quite a journey. Featuring: Google, Apple, and more.


How Tech Logos Have Evolved Over Time
This was originally posted on our Voronoi app. Download the app for free on iOS or Android and discover incredible data-driven charts from a variety of trusted sources.
One would be hard-pressed to find a company that has never changed its logo. Granted, some brands—like Rolex, IBM, and Coca-Cola—tend to just have more minimalistic updates. But other companies undergo an entire identity change, thus necessitating a full overhaul.
In this graphic, we visualized the evolution of prominent tech companies’ logos over time. All of these brands ranked highly in a Q1 2024 YouGov study of America’s most famous tech brands. The logo changes are sourced from 1000logos.net.
How Many Times Has Google Changed Its Logo?
Google and Facebook share a 98% fame rating according to YouGov. But while Facebook’s rise was captured in The Social Network (2010), Google’s history tends to be a little less lionized in popular culture.
For example, Google was initially called “Backrub” because it analyzed “back links” to understand how important a website was. Since its founding, Google has undergone eight logo changes, finally settling on its current one in 2015.
| Company | Number of Logo Changes |
|---|---|
| 8 | |
| HP | 8 |
| Amazon | 6 |
| Microsoft | 6 |
| Samsung | 6 |
| Apple | 5* |
Note: *Includes color changes. Source: 1000Logos.net
Another fun origin story is Microsoft, which started off as Traf-O-Data, a traffic counter reading company that generated reports for traffic engineers. By 1975, the company was renamed. But it wasn’t until 2012 that Microsoft put the iconic Windows logo—still the most popular desktop operating system—alongside its name.
And then there’s Samsung, which started as a grocery trading store in 1938. Its pivot to electronics started in the 1970s with black and white television sets. For 55 years, the company kept some form of stars from its first logo, until 1993, when the iconic encircled blue Samsung logo debuted.
Finally, Apple’s first logo in 1976 featured Isaac Newton reading under a tree—moments before an apple fell on his head. Two years later, the iconic bitten apple logo would be designed at Steve Jobs’ behest, and it would take another two decades for it to go monochrome.

-

 Travel1 week ago
Airline Incidents: How Do Boeing and Airbus Compare?
-

 Markets2 weeks ago
Visualizing America’s Shortage of Affordable Homes
-

 Green2 weeks ago
Ranked: Top Countries by Total Forest Loss Since 2001
-

 Money2 weeks ago
Where Does One U.S. Tax Dollar Go?
-

 Misc2 weeks ago
Almost Every EV Stock is Down After Q1 2024
-

 AI2 weeks ago
The Stock Performance of U.S. Chipmakers So Far in 2024
-

 Markets2 weeks ago
Charted: Big Four Market Share by S&P 500 Audits
-

 Real Estate2 weeks ago
Ranked: The Most Valuable Housing Markets in America