Politics
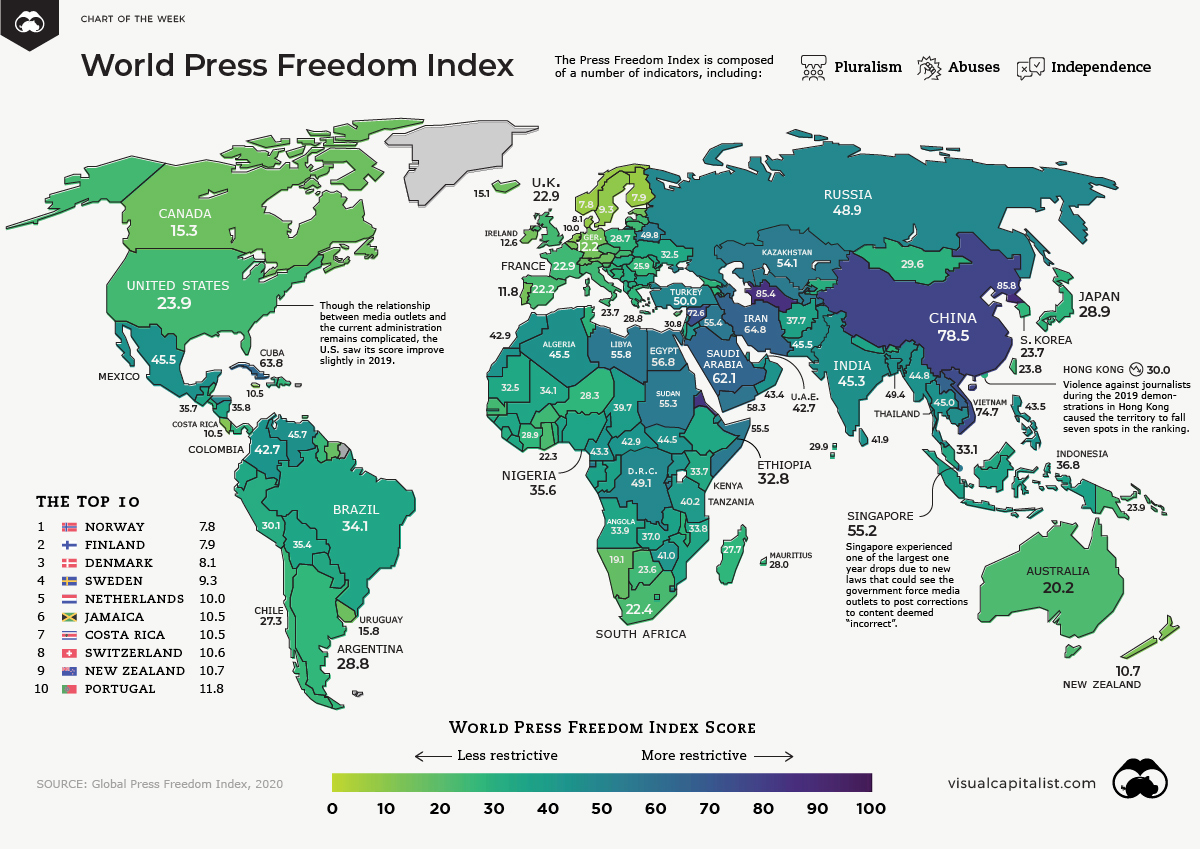
Mapped: The State of Press Freedom Around the World
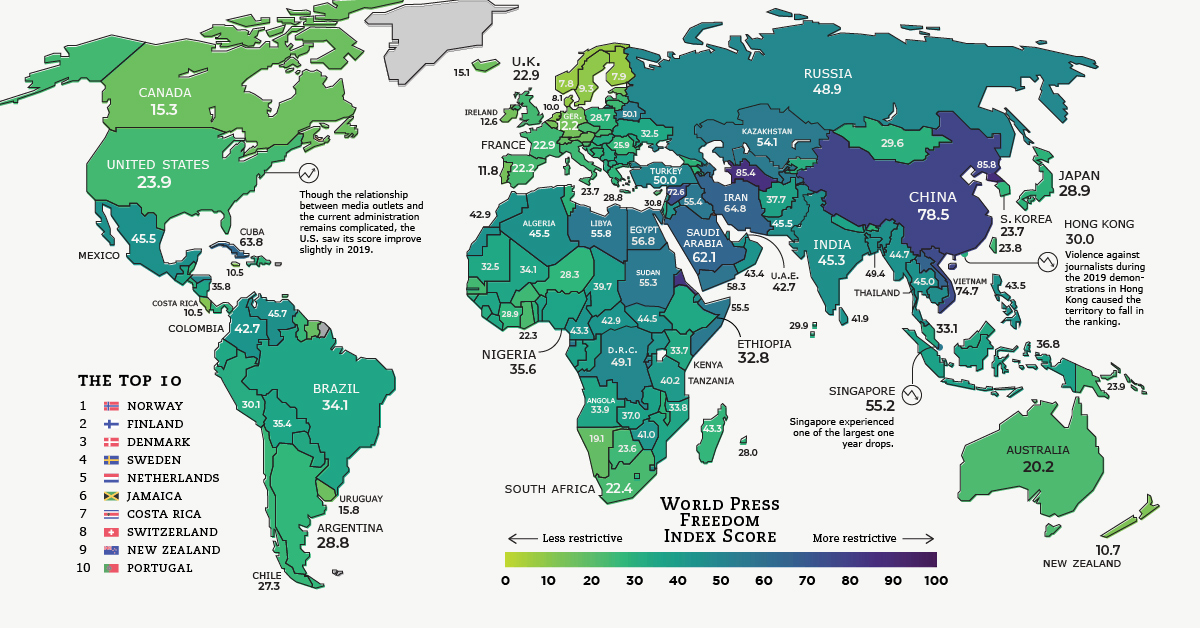
View a more detailed version of this map


Mapped: The State of Press Freedom Around the World
View a more detailed version of the above map by clicking here
In many Western countries, it’s easy to take press freedom for granted.
Instances of fake news, clickbait, and hyper-partisan reporting are points of consternation in the modern media landscape, and can sometimes overshadow the greater good that unrestricted journalism provides to society.
Of course, the ability to do that important work can vary significantly around the world. Being an investigative journalist in Sweden comes with a very different set of circumstances and considerations than doing the same thing in a country such as Saudi Arabia or Venezuela.
Today’s map highlights the results of the 2020 Global Press Freedom Index, produced by Reporters Without Borders. The report looks at press freedom in 180 countries and territories.
A Profession Not Without Its Risks
Today, nearly 75% of countries are in categories that the report describes as problematic, difficult, and very serious.
While these negative forces often come in the form of censorship and intimidation, journalism can be a risky profession in some of the more restrictive countries. One example is Mexico, where nearly 60 journalists were killed as a direct result of their reporting over the last decade.
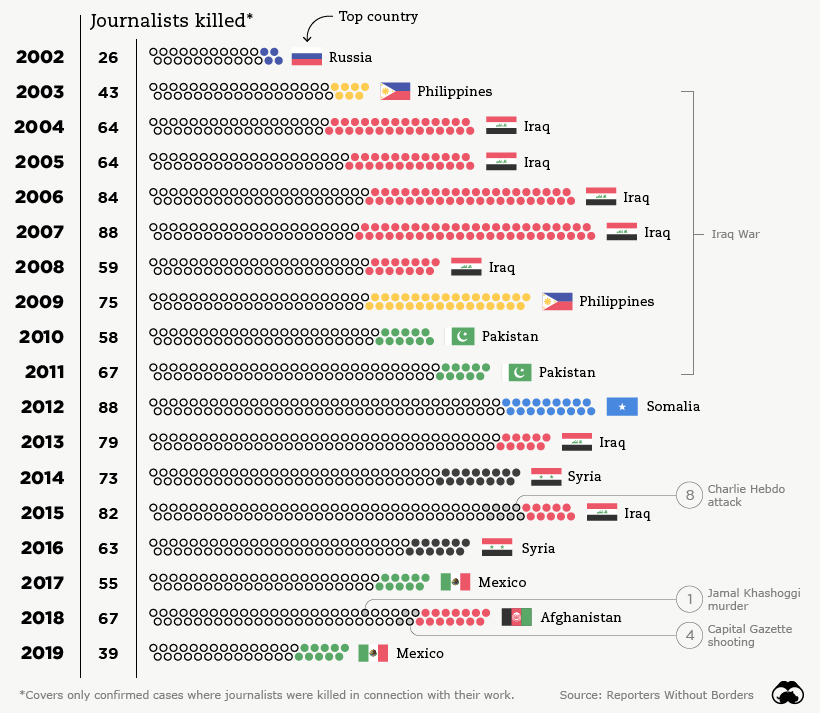
There is good news though: the number of journalists killed last year was the lowest since the report began in 2002.
Even better, press freedom scores increased around the world in the 2020 report.
Press Freedom: The Good, The Bad, The Ugly
Here are the scores for all 180 countries and territories covered in the report, sorted by 2020 ranking and score:
| Rank (2020) | Country or Region | Score (2020) | Prev. Rank (2019) | Change in Rank |
|---|---|---|---|---|
| #1 | 🇳🇴 Norway | 7.84 | 1 | 0 |
| #2 | 🇫🇮 Finland | 7.93 | 2 | 0 |
| #3 | 🇩🇰 Denmark | 8.13 | 5 | 2 |
| #4 | 🇸🇪 Sweden | 9.25 | 3 | -1 |
| #5 | 🇳🇱 Netherlands | 9.96 | 4 | -1 |
| #6 | 🇯🇲 Jamaica | 10.51 | 8 | 2 |
| #7 | 🇨🇷 Costa Rica | 10.53 | 10 | 3 |
| #8 | 🇨🇭 Switzerland | 10.62 | 6 | -2 |
| #9 | 🇳🇿 New Zealand | 10.69 | 7 | -2 |
| #10 | 🇵🇹 Portugal | 11.83 | 12 | 2 |
| #11 | Germany | 12.16 | 13 | 2 |
| #12 | Belgium | 12.57 | 9 | -3 |
| #13 | Ireland | 12.60 | 15 | 2 |
| #14 | Estonia | 12.61 | 11 | -3 |
| #15 | Iceland | 15.12 | 14 | -1 |
| #16 | Canada | 15.29 | 18 | 2 |
| #17 | Luxembourg | 15.46 | 17 | 0 |
| #18 | Austria | 15.78 | 16 | -2 |
| #19 | Uruguay | 15.79 | 19 | 0 |
| #20 | Suriname | 17.50 | 20 | 0 |
| #21 | Samoa | 18.25 | 22 | 1 |
| #22 | Latvia | 18.56 | 24 | 2 |
| #23 | Namibia | 19.25 | 23 | 0 |
| #24 | Liechtenstein | 19.52 | 26 | 2 |
| #25 | Cape Verde | 20.15 | 25 | 0 |
| #26 | Australia | 20.21 | 21 | -5 |
| #27 | Cyprus | 20.45 | 28 | 1 |
| #28 | Lithuania | 21.19 | 30 | 2 |
| #29 | Spain | 22.16 | 29 | 0 |
| #30 | Ghana | 22.26 | 27 | -3 |
| #31 | South Africa | 22.41 | 31 | 0 |
| #32 | Slovenia | 22.64 | 34 | 2 |
| #33 | Slovakia | 22.67 | 35 | 2 |
| #34 | France | 22.92 | 32 | -2 |
| #35 | United Kingdom | 22.93 | 33 | -2 |
| #36 | Trinidad and Tobago | 23.22 | 39 | 3 |
| #37 | Andorra | 23.23 | 37 | 0 |
| #38 | Burkina Faso | 23.47 | 36 | -2 |
| #39 | Botswana | 23.56 | 44 | 5 |
| #40 | Czech Republic | 23.57 | 40 | 0 |
| #41 | Italy | 23.69 | 43 | 2 |
| #42 | South Korea | 23.70 | 41 | -1 |
| #43 | Taiwan | 23.76 | 42 | -1 |
| #44 | OECS | 23.78 | 50 | 6 |
| #45 | United States | 23.85 | 48 | 3 |
| #46 | Papua New Guinea | 23.93 | 38 | -8 |
| #47 | Senegal | 23.99 | 49 | 2 |
| #48 | Romania | 25.91 | 47 | -1 |
| #49 | Guyana | 26.63 | 51 | 2 |
| #50 | Tonga | 27.27 | 45 | -5 |
| #51 | Chile | 27.31 | 46 | -5 |
| #52 | Fiji | 27.41 | 52 | 0 |
| #53 | Belize | 27.50 | 53 | 0 |
| #54 | Madagascar | 27.68 | 54 | 0 |
| #55 | Dominican Republic | 27.90 | 55 | 0 |
| #56 | Mauritius | 28.00 | 58 | 2 |
| #57 | Niger | 28.25 | 66 | 9 |
| #58 | Bosnia and Herzegovina | 28.51 | 63 | 5 |
| #59 | Croatia | 28.51 | 64 | 5 |
| #60 | Georgia | 28.59 | 60 | 0 |
| #61 | Armenia | 28.60 | 61 | 0 |
| #62 | Poland | 28.65 | 59 | -3 |
| #63 | Seychelles | 28.66 | 69 | 6 |
| #64 | Argentina | 28.78 | 57 | -7 |
| #65 | Greece | 28.80 | 65 | 0 |
| #66 | Japan | 28.86 | 67 | 1 |
| #67 | Bhutan | 28.90 | 80 | 13 |
| #68 | Ivory Coast | 28.94 | 71 | 3 |
| #69 | Malawi | 29.32 | 68 | -1 |
| #70 | Kosovo | 29.33 | 75 | 5 |
| #71 | Togo | 29.33 | 76 | 5 |
| #72 | Tunisia | 29.45 | 72 | 0 |
| #73 | Mongolia | 29.61 | 70 | -3 |
| #74 | El Salvador | 29.70 | 81 | 7 |
| #75 | Comoros | 29.77 | 56 | -19 |
| #76 | Panama | 29.78 | 79 | 3 |
| #77 | Cyprus North | 29.79 | 74 | -3 |
| #78 | East Timor | 29.90 | 84 | 6 |
| #79 | Maldives | 29.93 | 98 | 19 |
| #80 | Hong Kong | 30.01 | 73 | -7 |
| #81 | Malta | 30.16 | 77 | -4 |
| #82 | Kyrgyzstan | 30.19 | 83 | 1 |
| #83 | Haiti | 30.20 | 62 | -21 |
| #84 | Albania | 30.25 | 82 | -2 |
| #85 | Sierra Leone | 30.28 | 86 | 1 |
| #86 | Lesotho | 30.45 | 78 | -8 |
| #87 | Gambia | 30.62 | 92 | 5 |
| #88 | Israel | 30.84 | 88 | 0 |
| #89 | Hungary | 30.84 | 87 | -2 |
| #90 | Peru | 30.94 | 85 | -5 |
| #91 | Moldova | 31.16 | 91 | 0 |
| #92 | Macedonia | 31.28 | 95 | 3 |
| #93 | Serbia | 31.62 | 90 | -3 |
| #94 | Guinea-Bissau | 32.06 | 89 | -5 |
| #95 | Liberia | 32.25 | 93 | -2 |
| #96 | Ukraine | 32.52 | 102 | 6 |
| #97 | Mauritania | 32.54 | 94 | -3 |
| #98 | Ecuador | 32.62 | 97 | -1 |
| #99 | Ethiopia | 32.82 | 110 | 11 |
| #100 | Paraguay | 32.97 | 99 | -1 |
| #101 | Malaysia | 33.12 | 123 | 22 |
| #102 | Lebanon | 33.19 | 101 | -1 |
| #103 | Kenya | 33.72 | 100 | -3 |
| #104 | Mozambique | 33.79 | 103 | -1 |
| #105 | Montenegro | 33.83 | 104 | -1 |
| #106 | Angola | 33.92 | 109 | 3 |
| #107 | Brazil | 34.05 | 105 | -2 |
| #108 | Mali | 34.12 | 112 | 4 |
| #109 | Kuwait | 34.30 | 108 | -1 |
| #110 | Guinea | 34.34 | 107 | -3 |
| #111 | Bulgaria | 35.06 | 111 | 0 |
| #112 | Nepal | 35.10 | 106 | -6 |
| #113 | Benin | 35.11 | 96 | -17 |
| #114 | Bolivia | 35.37 | 113 | -1 |
| #115 | Nigeria | 35.63 | 120 | 5 |
| #116 | Guatemala | 35.74 | 116 | 0 |
| #117 | Nicaragua | 35.81 | 114 | -3 |
| #118 | Congo | 36.56 | 117 | -1 |
| #119 | Indonesia | 36.82 | 124 | 5 |
| #120 | Zambia | 37.00 | 119 | -1 |
| #121 | Gabon | 37.20 | 115 | -6 |
| #122 | Afghanistan | 37.70 | 121 | -1 |
| #123 | Chad | 39.70 | 122 | -1 |
| #124 | Tanzania | 40.25 | 118 | -6 |
| #125 | Uganda | 40.95 | 125 | 0 |
| #126 | Zimbabwe | 40.95 | 127 | 1 |
| #127 | Sri Lanka | 41.94 | 126 | -1 |
| #128 | Jordan | 42.08 | 130 | 2 |
| #129 | Qatar | 42.51 | 128 | -1 |
| #130 | Colombia | 42.66 | 129 | -1 |
| #131 | United Arab Emirates | 42.69 | 133 | 2 |
| #132 | C.A.R. | 42.87 | 145 | 13 |
| #133 | Morocco | 42.88 | 135 | 2 |
| #134 | Cameroon | 43.28 | 131 | -3 |
| #135 | Oman | 43.42 | 132 | -3 |
| #136 | Philippines | 43.54 | 134 | -2 |
| #137 | Palestine | 44.09 | 137 | 0 |
| #138 | South Sudan | 44.49 | 139 | 1 |
| #139 | Myanmar | 44.77 | 138 | -1 |
| #140 | Thailand | 44.94 | 136 | -4 |
| #141 | Swaziland | 45.15 | 147 | 6 |
| #142 | India | 45.33 | 140 | -2 |
| #143 | Mexico | 45.45 | 144 | 1 |
| #144 | Cambodia | 45.46 | 143 | -1 |
| #145 | Pakistan | 45.52 | 142 | -3 |
| #146 | Algeria | 45.52 | 141 | -5 |
| #147 | Venezuela | 45.66 | 148 | 1 |
| #148 | Honduras | 48.20 | 146 | -2 |
| #149 | Russian Federation | 48.92 | 149 | 0 |
| #150 | Congo (DRC) | 49.09 | 154 | 4 |
| #151 | Bangladesh | 49.37 | 150 | -1 |
| #152 | Brunei | 49.65 | 152 | 0 |
| #153 | Belarus | 49.75 | 153 | 0 |
| #154 | Turkey | 50.02 | 157 | 3 |
| #155 | Rwanda | 50.34 | 155 | 0 |
| #156 | Uzbekistan | 53.07 | 160 | 4 |
| #157 | Kazakhstan | 54.11 | 158 | 1 |
| #158 | Singapore | 55.23 | 151 | -7 |
| #159 | Sudan | 55.33 | 175 | 16 |
| #160 | Burundi | 55.33 | 159 | -1 |
| #161 | Tajikistan | 55.34 | 161 | 0 |
| #162 | Iraq | 55.37 | 156 | -6 |
| #163 | Somalia | 55.45 | 164 | 1 |
| #164 | Libya | 55.77 | 162 | -2 |
| #165 | Equatorial Guinea | 56.38 | 165 | 0 |
| #166 | Egypt | 56.82 | 163 | -3 |
| #167 | Yemen | 58.25 | 168 | 1 |
| #168 | Azerbaijan | 58.48 | 166 | -2 |
| #169 | Bahrain | 60.13 | 167 | -2 |
| #170 | Saudi Arabia | 62.14 | 172 | 2 |
| #171 | Cuba | 63.81 | 169 | -2 |
| #172 | Laos | 64.28 | 171 | -1 |
| #173 | Iran | 64.81 | 170 | -3 |
| #174 | Syria | 72.57 | 174 | 0 |
| #175 | Vietnam | 74.71 | 176 | 1 |
| #176 | Djibouti | 76.73 | 173 | -3 |
| #177 | China | 78.48 | 177 | 0 |
| #178 | Eritrea | 83.50 | 178 | 0 |
| #179 | Turkmenistan | 85.44 | 180 | 1 |
| #180 | North Korea | 85.82 | 179 | -1 |
Which countries stood out in this year’s edition of the press freedom rankings?
Norway: Nordic Countries have topped the Press Freedom Index since its inception, and Norway (Rank: #1) in particular is an example for the world. Despite a very free media environment, the government recently mandated a commission to conduct a comprehensive review of the conditions for freedom of speech. Members will consider measures to promote the broadest possible participation in the public debate, and means to hamper the spread of fake news and hate speech.
Malaysia: A new government ushered in a less restrictive era in Malaysia in 2018. Journalists and media outlets that had been blacklisted were able to resume working, and anti-fake news laws that were viewed as problematic were repealed. As a result, Malaysia’s index score has improved by 15 points in the past two years. This is in sharp contrast to neighbor, Singapore, which is ranked 158th out of 180 countries.
Ethiopia: When Abiy Ahmed Ali took power in Africa’s second most populous country in 2018, his government restored access to over 200 news websites and blogs that had been previously blocked. As well, many detained journalists and bloggers were released as the chill over the country’s highly restrictive media environment began to thaw. As a result, Ethiopia (#99) jumped up eleven spots in the Press Freedom Index in 2020.
The Middle East: Though the situation in this region has begun to stabilize somewhat, restrictions still remain – even in relatively safe and stable countries. Both Saudi Arabia (#170) and Egypt (#166) have imprisoned a number of journalists in recent years, and the former is still dealing with the reputational fallout from the assassination of Saudi dissident and Washington Post columnist, Jamal Khashoggi.
China: Sitting near the bottom of the list is China (#176). More than 100 journalists and bloggers are currently detained as the country maintains a tight grip over the press – particularly as COVID-19 began to spread. Earlier this year, the Chinese government also expelled over a dozen journalists representing U.S. publications.
2020: A Pivotal Year for the Press
As the world grapples with a deadly pandemic, a global economic shutdown, and a crucial election year, the media could find itself in the spotlight more than in previous years.
How the stories of 2020 are told will influence our collective future – and how regimes choose to treat journalists under this atypical backdrop will tell us a lot about press freedom going forward.
Economy
The Bloc Effect: International Trade with Geopolitical Allies on the Rise
Rising geopolitical tensions are shaping the future of international trade, but what is the effect on trading among G7 and BRICS countries?


The Bloc Effect: International Trade with Allies on the Rise
International trade has become increasingly fragmented over the last five years as countries have shifted to trading more with their geopolitical allies.
This graphic from The Hinrich Foundation, the first in a three-part series covering the future of trade, provides visual context to the growing divide in trade in G7 and pre-expansion BRICS countries, which are used as proxies for geopolitical blocs.
Trade Shifts in G7 and BRICS Countries
This analysis uses IMF data to examine differences in shares of exports within and between trading blocs from 2018 to 2023. For example, we looked at the percentage of China’s exports with other BRICS members as well as with G7 members to see how these proportions shifted in percentage points (pp) over time.
Countries traded nearly $270 billion more with allies in 2023 compared to 2018. This shift came at the expense of trade with rival blocs, which saw a decline of $314 billion.
Country Change in Exports Within Bloc (pp) Change in Exports With Other Bloc (pp)
🇮🇳 India 0.0 3.9
🇷🇺 Russia 0.7 -3.8
🇮🇹 Italy 0.8 -0.7
🇨🇦 Canada 0.9 -0.7
🇫🇷 France 1.0 -1.1
🇪🇺 EU 1.1 -1.5
🇩🇪 Germany 1.4 -2.1
🇿🇦 South Africa 1.5 1.5
🇺🇸 U.S. 1.6 -0.4
🇯🇵 Japan 2.0 -1.7
🇨🇳 China 2.1 -5.2
🇧🇷 Brazil 3.7 -3.3
🇬🇧 UK 10.2 0.5
All shifts reported are in percentage points. For example, the EU saw its share of exports to G7 countries rise from 74.3% in 2018 to 75.4% in 2023, which equates to a 1.1 percentage point increase.
The UK saw the largest uptick in trading with other countries within the G7 (+10.2 percentage points), namely the EU, as the post-Brexit trade slump to the region recovered.
Meanwhile, the U.S.-China trade dispute caused China’s share of exports to the G7 to fall by 5.2 percentage points from 2018 to 2023, the largest decline in our sample set. In fact, partly as a result of the conflict, the U.S. has by far the highest number of harmful tariffs in place.
The Russia-Ukraine War and ensuing sanctions by the West contributed to Russia’s share of exports to the G7 falling by 3.8 percentage points over the same timeframe.
India, South Africa, and the UK bucked the trend and continued to witness advances in exports with the opposing bloc.
Average Trade Shifts of G7 and BRICS Blocs
Though results varied significantly on a country-by-country basis, the broader trend towards favoring geopolitical allies in international trade is clear.
Bloc Change in Exports Within Bloc (pp) Change in Exports With Other Bloc (pp)
Average 2.1 -1.1
BRICS 1.6 -1.4
G7 incl. EU 2.4 -1.0
Overall, BRICS countries saw a larger shift away from exports with the other bloc, while for G7 countries the shift within their own bloc was more pronounced. This implies that though BRICS countries are trading less with the G7, they are relying more on trade partners outside their bloc to make up for the lost G7 share.
A Global Shift in International Trade and Geopolitical Proximity
The movement towards strengthening trade relations based on geopolitical proximity is a global trend.
The United Nations categorizes countries along a scale of geopolitical proximity based on UN voting records.
According to the organization’s analysis, international trade between geopolitically close countries rose from the first quarter of 2022 (when Russia first invaded Ukraine) to the third quarter of 2023 by over 6%. Conversely, trade with geopolitically distant countries declined.
The second piece in this series will explore China’s gradual move away from using the U.S. dollar in trade settlements.
Visit the Hinrich Foundation to learn more about the future of geopolitical trade

-

 Economy1 day ago
Economic Growth Forecasts for G7 and BRICS Countries in 2024
The IMF has released its economic growth forecasts for 2024. How do the G7 and BRICS countries compare?
-

 United States2 weeks ago
Ranked: The Largest U.S. Corporations by Number of Employees
We visualized the top U.S. companies by employees, revealing the massive scale of retailers like Walmart, Target, and Home Depot.
-

 Economy2 weeks ago
Where U.S. Inflation Hit the Hardest in March 2024
We visualized product categories that saw the highest % increase in price due to U.S. inflation as of March 2024.
-

 Economy4 weeks ago
G20 Inflation Rates: Feb 2024 vs COVID Peak
We visualize inflation rates across G20 countries as of Feb 2024, in the context of their COVID-19 pandemic peak.
-

 Economy1 month ago
Mapped: Unemployment Claims by State
This visual heatmap of unemployment claims by state highlights New York, California, and Alaska leading the country by a wide margin.
-

 Economy2 months ago
Confidence in the Global Economy, by Country
Will the global economy be stronger in 2024 than in 2023?


-

 Mining1 week ago
Gold vs. S&P 500: Which Has Grown More Over Five Years?
-

 Markets2 weeks ago
Ranked: The Most Valuable Housing Markets in America
-

 Money2 weeks ago
Which States Have the Highest Minimum Wage in America?
-

 AI2 weeks ago
Ranked: Semiconductor Companies by Industry Revenue Share
-

 Markets2 weeks ago
Ranked: The World’s Top Flight Routes, by Revenue
-

 Countries2 weeks ago
Population Projections: The World’s 6 Largest Countries in 2075
-

 Markets2 weeks ago
The Top 10 States by Real GDP Growth in 2023
-

 Demographics2 weeks ago
The Smallest Gender Wage Gaps in OECD Countries