Misc
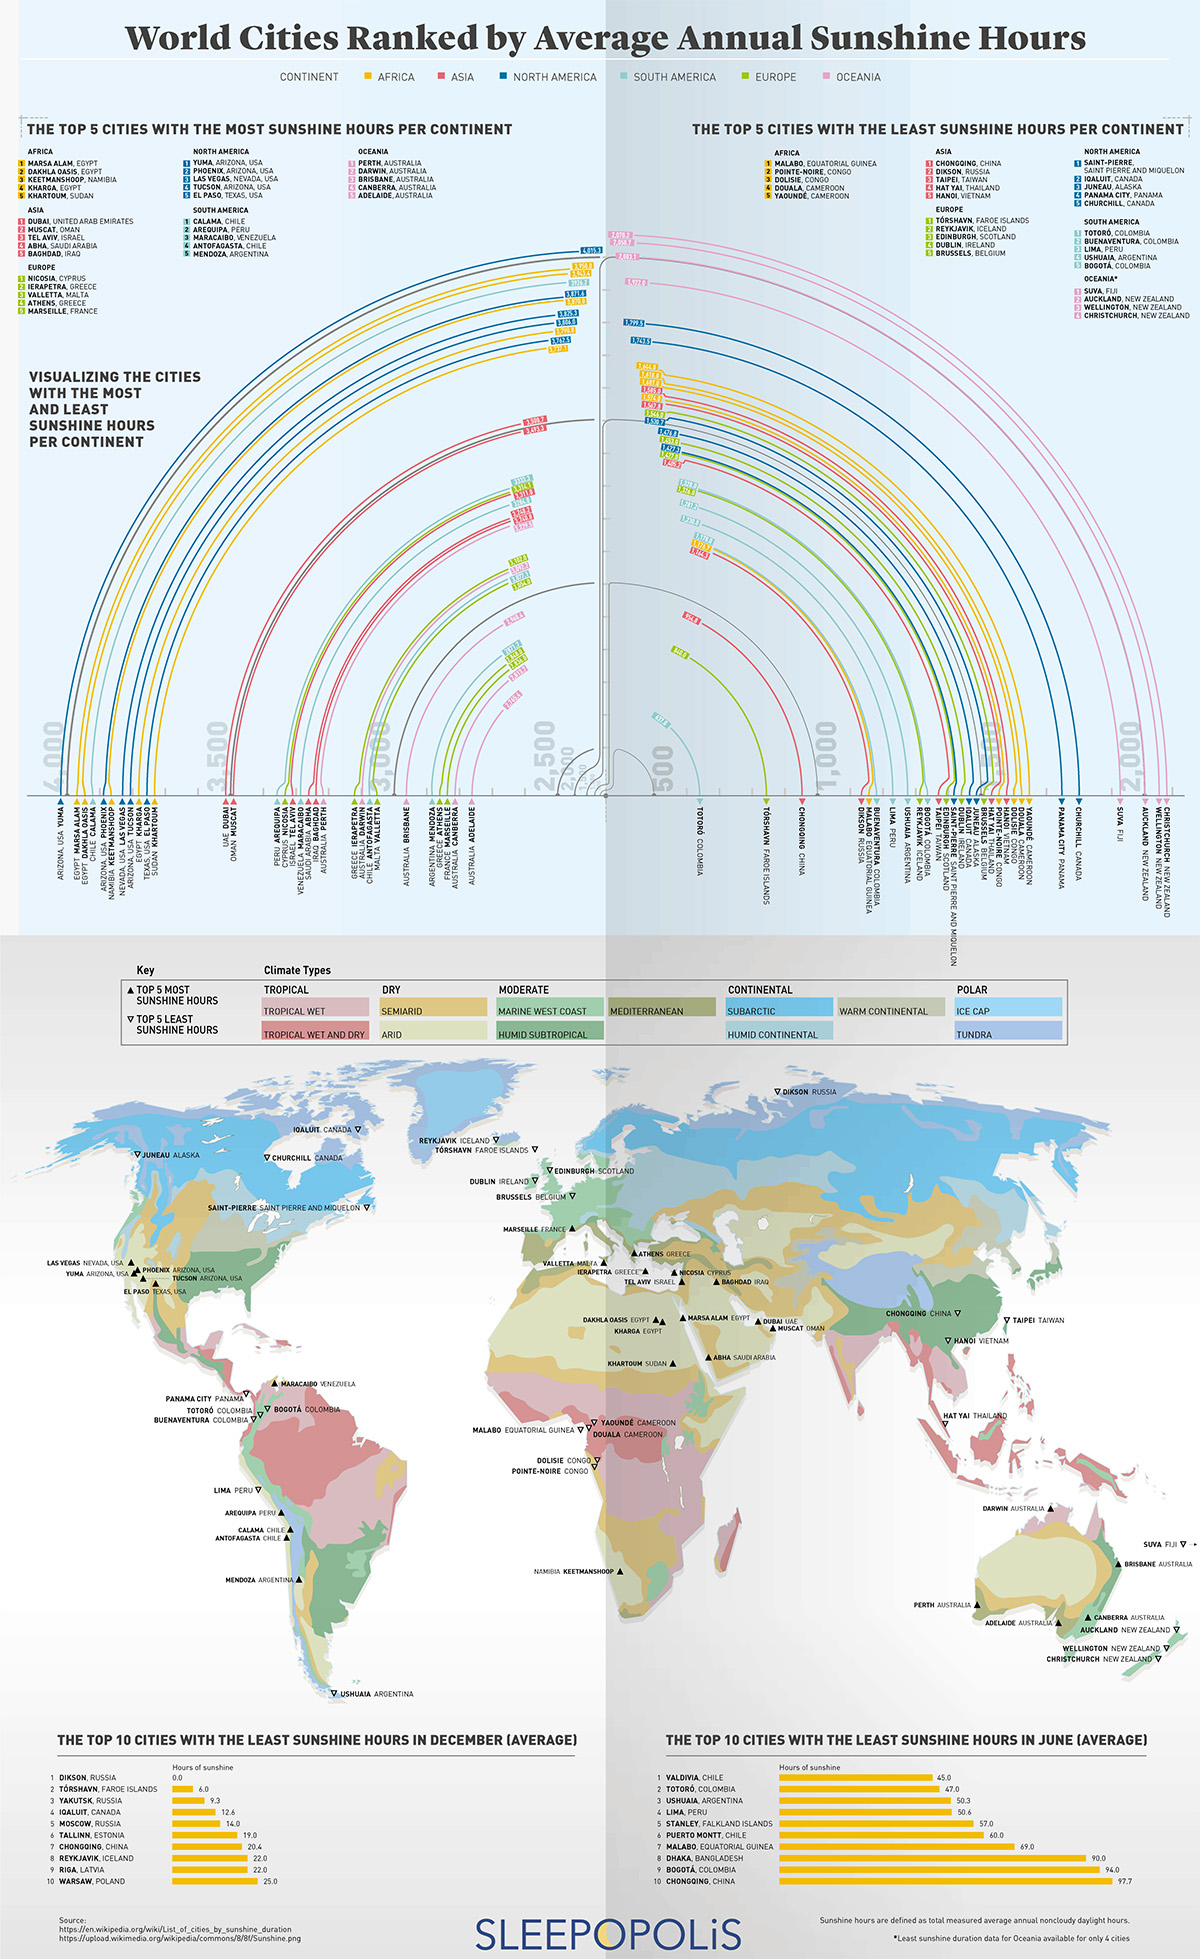
World Cities Ranked by Average Annual Sunshine Hours
View the full size version of this infographic
World Cities Ranked by Average Annual Sunshine Hours
View the high resolution of this infographic by clicking here
While we all see the same sky, we see it a bit differently depending on where we stand.
For those in the planet’s most extreme regions, the sun doesn’t follow the same pattern of seasons as it does in more temperate regions.
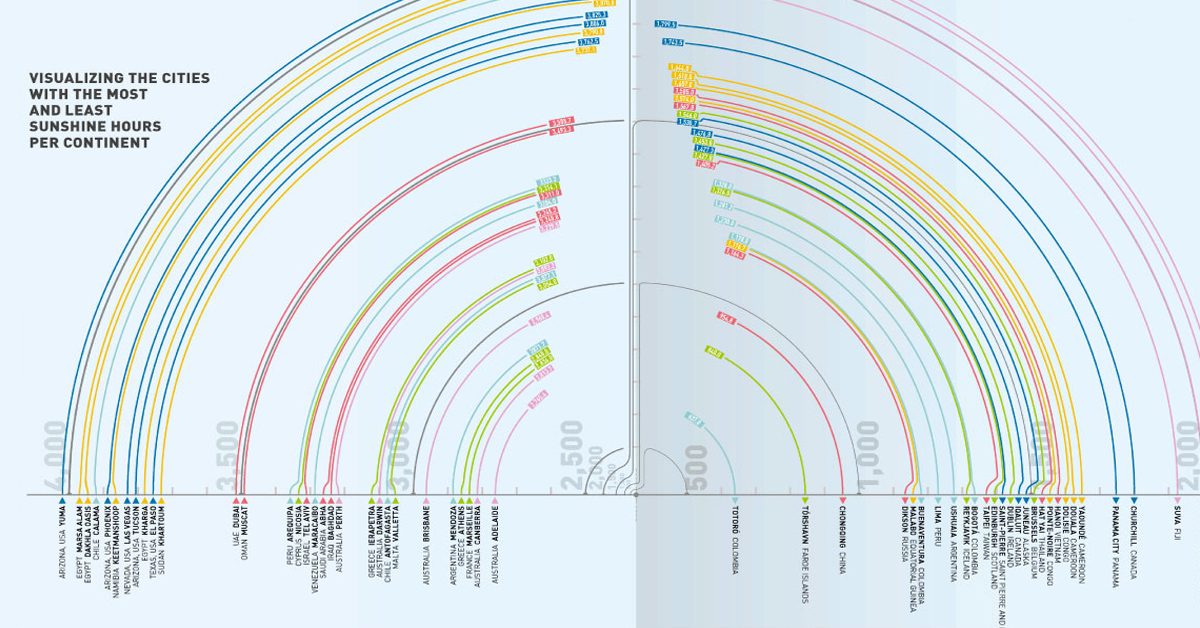
Today’s visualization comes from Sleepopolis and summarizes the top cities on each continent that receive the most and least annual sunshine hours.
Ranked: Cities with the Least and Most Sunshine Hours
While the graphic groups the top five cities from each continent, the tables below highlight the top 10 cities from around the world that boast the highest and lowest annual sunshine hours.
Top 10 Cities with the Most Annual Sunshine
| City | Country | Climate | # of Sunshine Hours |
|---|---|---|---|
| Yuma | United States | Arid | 4,015.3 |
| Marsa Alam | Egypt | Arid | 3,958.0 |
| Dakhla Oasis | Egypt | Arid | 3,943.4 |
| Calama | Chile | Arid, Marine West Coast, Tundra | 3,926.2 |
| Phoenix | United States | Arid | 3,871.6 |
| Keetmanshoop | Namibia | Arid | 3,870.0 |
| Las Vegas | United States | Arid | 3,825.3 |
| Tucson | United States | Arid | 3,806.0 |
| Kharga | Egypt | Arid | 3,790.8 |
| El Paso | United States | Semiarid | 3,762.5 |
The sunniest city on Earth is Yuma, Arizona in the U.S. As the driest city in the U.S., Yuma receives less than 200 millimeters (8 inches) of rainfall and endures roughly 100 days of 40°C (104°F) weather every year. Yuma lies between the Gila and Colorado rivers, in a lush region that produces almost 90% of leafy vegetables grown in the U.S.
Arizona boasts three of the top 10 sunniest cities in the world, including Phoenix in the fifth spot, which is the 5th most populous city in the U.S. and is known as “the Valley of the Sun”.
Perhaps unsurprisingly, Egypt also has three cities in the top 10 list, with Marsa Alam, Dakhla Oasis, and Kharga claiming the 2nd, 3rd, and 9th sunniest spots, respectively. Dakhla Oasis, or “inner oasis”, receives practically zero precipitation each year.
Top 10 Cities with the Least Annual Sunshine
| City | Country | Climate | # of Sunshine Hours |
|---|---|---|---|
| Totoró | Colombia | Marine West Coast | 637.0 |
| Tórshavn | Faroe Islands | Marine West Coast | 840.0 |
| Chongqing | China | Humid Subtropical | 954.8 |
| Dikson | Russia | Tundra | 1,164.3 |
| Malabo | Equatorial Guinea | Tropical Wet and Dry | 1,176.7 |
| Buenaventura | Colombia | Tropical Wet and Dry, Humid Subtropical | 1,178.0 |
| Lima | Peru | Arid | 1,230.0 |
| Ushuaia | Argentina | Tundra | 1,281.2 |
| Reykjavik | Iceland | Tundra, Marine West Coast | 1,326.0 |
| Bogotá | Colombia | Marine West Coast | 1,328.0 |
Although perceived as a sunny location, Colombia borders both the Caribbean Sea and the Pacific Ocean, exposing it to higher variety in weather patterns and precipitation. Colombia alone is home to three of the top 10 cities with the lowest hours of annual sunshine.
Ranking second-to-last in the number of sunshine hours, Torshavn lies between the Scottish coast and Iceland and receives roughly 37 days of sunshine every year; the average temperatures on this island barely reach above 5°C (41°F).
Our sun doesn’t shine at the same level of brightness all the time. NASA has observed that the sun goes through “solar cycles” that last roughly 11 years─brightening and dimming at relatively regular intervals and impacting how intensely we receive sunlight at any given time.
Sunshine Near the Poles
Humans typically need exposure to the sun to maintain healthy sleep habits, as our brain has been hardwired to follow natural waking and sleeping rhythms.
However, several cities experience no sun at all for several months at a time in what’s known as the “Polar Night”.
- Tromsø, Norway: winter darkness is enjoyed rather than endured, as it can last for over a month
- Svalbard, Norway: even indirect sunlight is absent, with no change in sunlight to help indicate a 24-hour day
- Dikson, Russia: receives no sunlight whatsoever in December
Wherever you live, people have been watching and tracking the movements of the sun with rapt attention for millennia, even when we couldn’t see it.


Politics
Charted: Trust in Government Institutions by G7 Countries
How much do you trust the government and its various institutions? We look at data for G7 countries for the time period of 2006-2023.


Trust in Government Institutions by G7 Countries
This was originally posted on our Voronoi app. Download the app for free on iOS or Android and discover incredible data-driven charts from a variety of trusted sources.
How much do you trust the government, and its various institutions?
It’s likely that your level of confidence probably depends on a wide range of factors, such as perceived competency, historical context, economic performance, accountability, social cohesion, and transparency.
And for these same reasons, trust levels in government institutions also change all the time, even in the world’s most developed countries: the G7.
Confidence in Government by G7 Countries (2006-2023)
This chart looks at the changes in trust in government institutions between the years 2006 and 2023, based on data from a multi-country Gallup poll.
Specifically, this dataset aggregates confidence in multiple national institutions, including the military, the judicial system, the national government, and the integrity of the electoral system.
| Country | Confidence (2006) | Confidence (2023) | Change (p.p.) |
|---|---|---|---|
| Canada | 57% | 64% | +7 |
| Britain | 63% | 63% | +0 |
| Germany | 55% | 61% | +6 |
| France | 54% | 60% | +6 |
| Japan | 48% | 59% | +11 |
| Italy | 41% | 54% | +13 |
| United States | 63% | 50% | -13 |
What’s interesting here is that in the G7, a group of the world’s most developed economies, there is only one country bucking the general trend: the United States.
Across most G7 countries, confidence in institutions has either improved or stayed the same between 2006 and 2023. The largest percentage point (p.p.) increases occur in Italy and Japan, which saw +13 p.p. and +11 p.p. increases in trust over the time period.
In the U.S., however, confidence in government institutions has fallen by 13 p.p. over the years. What happened?
Key Figures on U.S. Trust in Institutions
In 2006, the U.S. was tied with the UK as having the highest confidence in government institutions, at 63%.
But here’s where the scores stand in 2023, across various institutions:
| 🇺🇸 Institutions | Confidence (2023) |
|---|---|
| Military | 81% |
| Judiciary | 42% |
| National Government | 30% |
| Elections | 44% |
| Overall | 49% |
Based on this data, it’s clear that the U.S. lags behind in three key indicators: confidence in the national government, confidence in the justice system, and confidence in fair elections. It ranked in last place for each indicator in the G7.
One other data point that stands out: despite leading the world in military spending, the U.S. is only the third most confident in its military in the G7. It lags behind France (86%) and the United Kingdom (83%).

-

 Wealth6 days ago
Charted: Which City Has the Most Billionaires in 2024?
-

 Mining2 weeks ago
Gold vs. S&P 500: Which Has Grown More Over Five Years?
-

 Uranium2 weeks ago
The World’s Biggest Nuclear Energy Producers
-

 Education2 weeks ago
How Hard Is It to Get Into an Ivy League School?
-

 Debt2 weeks ago
How Debt-to-GDP Ratios Have Changed Since 2000
-

 Sports2 weeks ago
The Highest Earning Athletes in Seven Professional Sports
-

 Science2 weeks ago
Visualizing the Average Lifespans of Mammals
-

 Brands1 week ago
How Tech Logos Have Evolved Over Time