Politics
Visualizing 200 Years of Systems of Government
Visualizing 200 Years of Systems of Government
Centuries ago, most of our ancestors were living under a different political paradigm.
Although democracy was starting to show signs of growth in some parts of the world, it was more of an idea, rather than an established or accepted system of government.
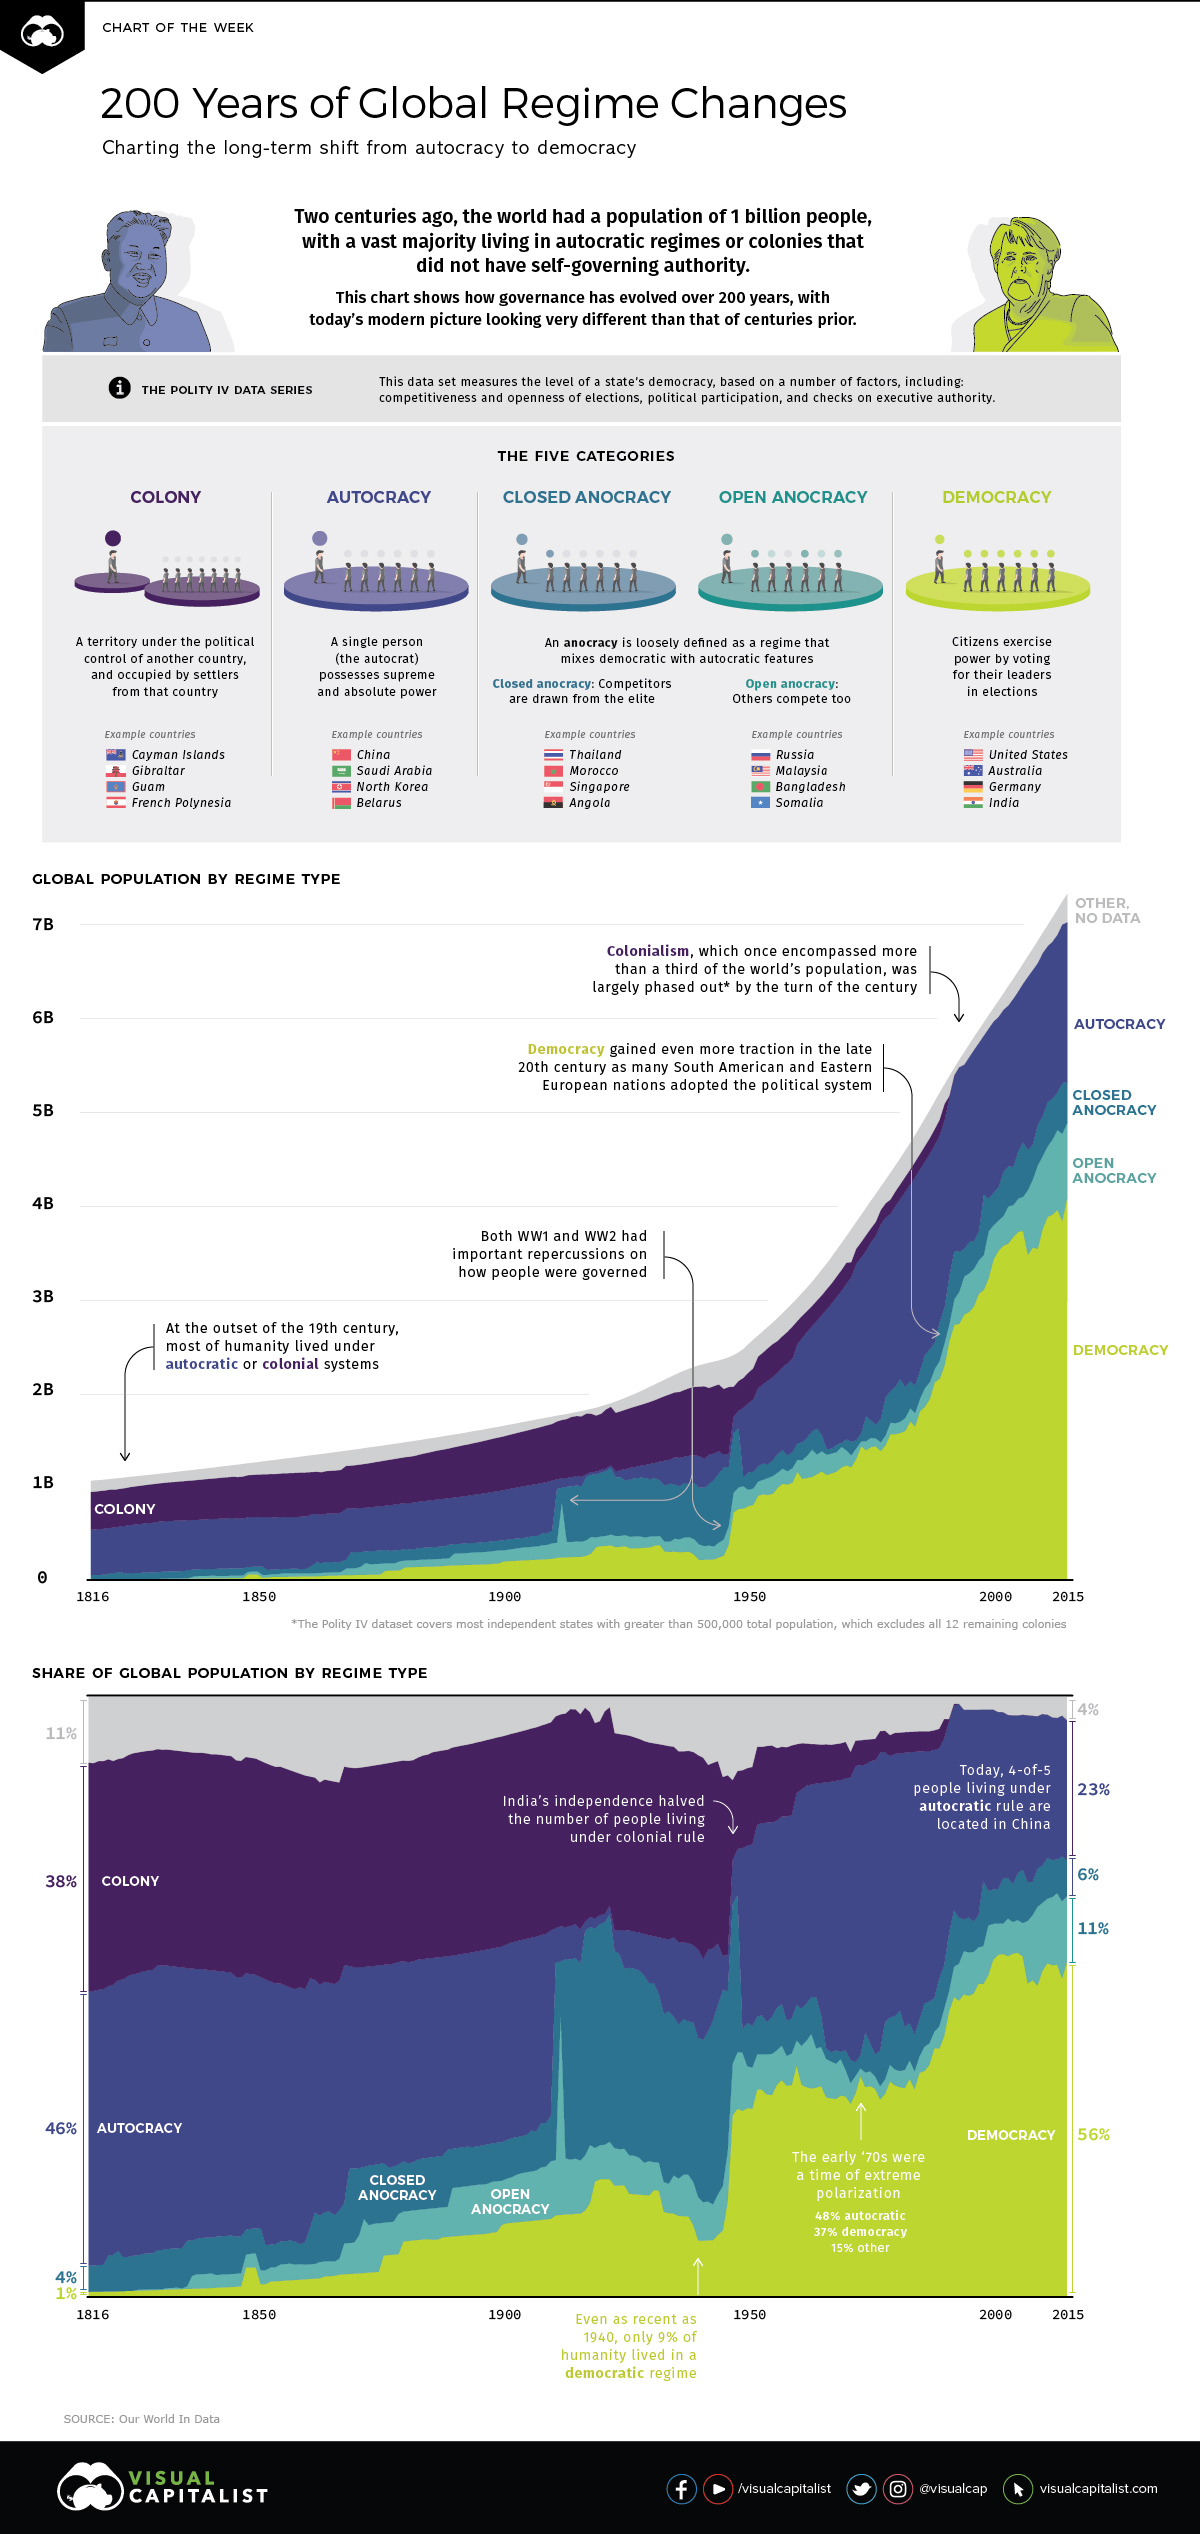
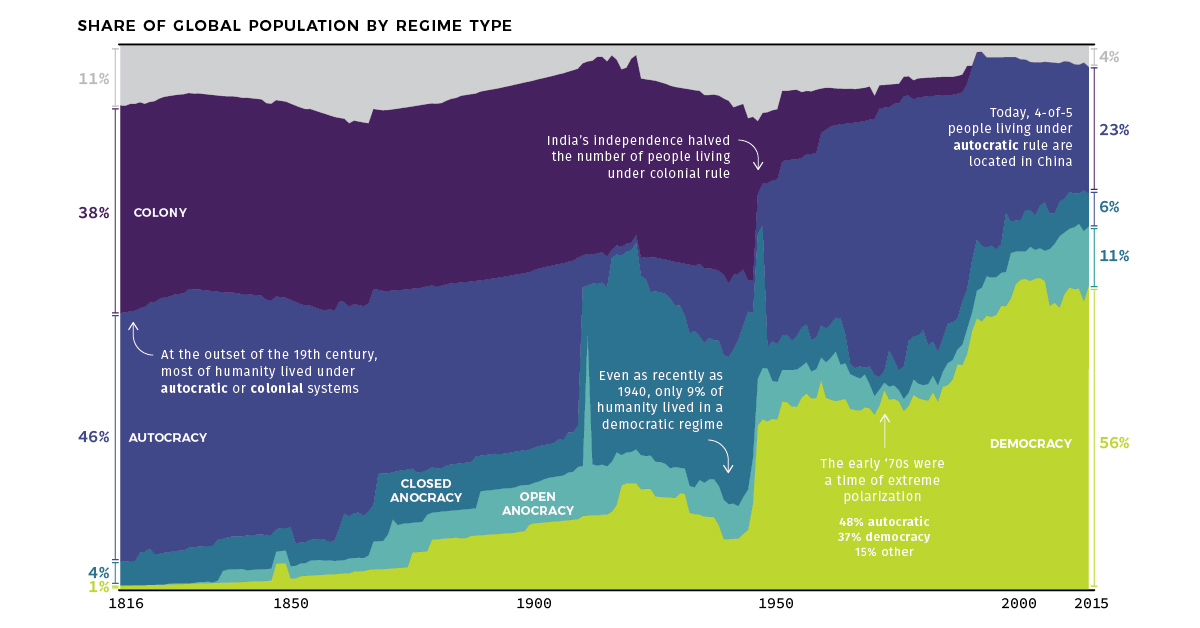
Even at the start of the 19th century, for example, it’s estimated that the vast majority of the global population — roughly 84% of all people — still lived under in autocratic regimes or colonies that lacked the authority to self-govern their own affairs.
The Evolution of Rule
Today’s set of charts look at global governance, and how it’s evolved over the last two centuries of human history.
Leveraging data from the widely-used Polity IV data set on political regimes, as well as the work done by economist Max Roser through Our World in Data, we’ve plotted an empirical view of how people are governed.
Specifically, our charts break down the global population by how they are governed (in absolute terms), as well as by the relative share of population living under those same systems of government (percentage terms).
Classifying Systems of Government
The Polity IV data series defines a state’s level of democracy by ranking it on several metrics, such as competitive and open elections, political participation, and checks on authority.
Polity scores are on a -10 to +10 scale, where the lower end (-10 to -6) corresponds with autocracies and the upper end (+6 to +10) corresponds to democracies. Below are five types of government that can be derived from the scale, and that are shown in the visualization.
- Colony
A territory under the political control of another country, and/or occupied by settlers from that country.
Examples: 🇬🇮 Gibraltar, 🇬🇺 Guam, 🇵🇫 French Polynesia - Autocracy
A single person (the autocrat) possesses supreme and absolute power.
Examples: 🇨🇳 China, 🇸🇦 Saudi Arabia, 🇰🇵 North Korea - Closed Anocracy
An anocracy is loosely defined as a regime that mixes democratic and autocratic features. In a closed anocracy, political competitors are drawn only from an elite and well-connected pool.
Examples: 🇹🇭 Thailand, 🇲🇦 Morocco, 🇸🇬 Singapore - Open Anocracy
Similar to a closed anocracy, an open anocracy draws political competitors from beyond elite groups.
Examples: 🇷🇺 Russia, 🇲🇾 Malaysia, 🇧🇩 Bangladesh - Democracy
Citizens exercise power by voting for their leaders in elections.
Examples: 🇺🇸 United States, 🇩🇪 Germany, 🇮🇳 India
A Long-Term Trend in Question
In the early 19th century, less than 1% of the global population could be found in democracies.
In more recent decades, however, the dominoes have fallen — and today, it’s estimated that 56% of the world population lives in societies that can be considered democratic, at least according to the Polity IV data series highlighted above.
While there are questions regarding a recent decline in freedom around the world, it’s worth considering that democratic governance is still a relatively new tradition within a much broader historical context.
Will the long-term trend of democracy prevail, or are the more recent indications of populism a sign of reversion?


Economy
The Bloc Effect: International Trade with Geopolitical Allies on the Rise
Rising geopolitical tensions are shaping the future of international trade, but what is the effect on trading among G7 and BRICS countries?


The Bloc Effect: International Trade with Allies on the Rise
International trade has become increasingly fragmented over the last five years as countries have shifted to trading more with their geopolitical allies.
This graphic from The Hinrich Foundation, the first in a three-part series covering the future of trade, provides visual context to the growing divide in trade in G7 and pre-expansion BRICS countries, which are used as proxies for geopolitical blocs.
Trade Shifts in G7 and BRICS Countries
This analysis uses IMF data to examine differences in shares of exports within and between trading blocs from 2018 to 2023. For example, we looked at the percentage of China’s exports with other BRICS members as well as with G7 members to see how these proportions shifted in percentage points (pp) over time.
Countries traded nearly $270 billion more with allies in 2023 compared to 2018. This shift came at the expense of trade with rival blocs, which saw a decline of $314 billion.
Country Change in Exports Within Bloc (pp) Change in Exports With Other Bloc (pp)
🇮🇳 India 0.0 3.9
🇷🇺 Russia 0.7 -3.8
🇮🇹 Italy 0.8 -0.7
🇨🇦 Canada 0.9 -0.7
🇫🇷 France 1.0 -1.1
🇪🇺 EU 1.1 -1.5
🇩🇪 Germany 1.4 -2.1
🇿🇦 South Africa 1.5 1.5
🇺🇸 U.S. 1.6 -0.4
🇯🇵 Japan 2.0 -1.7
🇨🇳 China 2.1 -5.2
🇧🇷 Brazil 3.7 -3.3
🇬🇧 UK 10.2 0.5
All shifts reported are in percentage points. For example, the EU saw its share of exports to G7 countries rise from 74.3% in 2018 to 75.4% in 2023, which equates to a 1.1 percentage point increase.
The UK saw the largest uptick in trading with other countries within the G7 (+10.2 percentage points), namely the EU, as the post-Brexit trade slump to the region recovered.
Meanwhile, the U.S.-China trade dispute caused China’s share of exports to the G7 to fall by 5.2 percentage points from 2018 to 2023, the largest decline in our sample set. In fact, partly as a result of the conflict, the U.S. has by far the highest number of harmful tariffs in place.
The Russia-Ukraine War and ensuing sanctions by the West contributed to Russia’s share of exports to the G7 falling by 3.8 percentage points over the same timeframe.
India, South Africa, and the UK bucked the trend and continued to witness advances in exports with the opposing bloc.
Average Trade Shifts of G7 and BRICS Blocs
Though results varied significantly on a country-by-country basis, the broader trend towards favoring geopolitical allies in international trade is clear.
Bloc Change in Exports Within Bloc (pp) Change in Exports With Other Bloc (pp)
Average 2.1 -1.1
BRICS 1.6 -1.4
G7 incl. EU 2.4 -1.0
Overall, BRICS countries saw a larger shift away from exports with the other bloc, while for G7 countries the shift within their own bloc was more pronounced. This implies that though BRICS countries are trading less with the G7, they are relying more on trade partners outside their bloc to make up for the lost G7 share.
A Global Shift in International Trade and Geopolitical Proximity
The movement towards strengthening trade relations based on geopolitical proximity is a global trend.
The United Nations categorizes countries along a scale of geopolitical proximity based on UN voting records.
According to the organization’s analysis, international trade between geopolitically close countries rose from the first quarter of 2022 (when Russia first invaded Ukraine) to the third quarter of 2023 by over 6%. Conversely, trade with geopolitically distant countries declined.
The second piece in this series will explore China’s gradual move away from using the U.S. dollar in trade settlements.
Visit the Hinrich Foundation to learn more about the future of geopolitical trade

-

 Economy8 hours ago
Ranked: The Top 20 Countries in Debt to China
The 20 nations featured in this graphic each owe billions in debt to China, posing concerns for their economic future.
-

 Markets14 hours ago
The Best U.S. Companies to Work for According to LinkedIn
We visualized the results of a LinkedIn study on the best U.S. companies to work for in 2024.
-

 Misc2 days ago
Visualizing the Most Common Pets in the U.S.
Lions, tigers, and bears, oh my!—these animals do not feature on this list of popular American household pets.
-

 Markets5 days ago
Economic Growth Forecasts for G7 and BRICS Countries in 2024
The IMF has released its economic growth forecasts for 2024. How do the G7 and BRICS countries compare?
-

 United States2 weeks ago
Ranked: The Largest U.S. Corporations by Number of Employees
We visualized the top U.S. companies by employees, revealing the massive scale of retailers like Walmart, Target, and Home Depot.
-

 United States3 weeks ago
Where U.S. Inflation Hit the Hardest in March 2024
We visualized product categories that saw the highest % increase in price due to U.S. inflation as of March 2024.


-

 Demographics7 days ago
The Countries That Have Become Sadder Since 2010
-

 Green2 weeks ago
Ranked: The Countries With the Most Air Pollution in 2023
-

 Green2 weeks ago
Ranking the Top 15 Countries by Carbon Tax Revenue
-

 Markets2 weeks ago
U.S. Debt Interest Payments Reach $1 Trillion
-

 Mining2 weeks ago
Gold vs. S&P 500: Which Has Grown More Over Five Years?
-

 Energy2 weeks ago
The World’s Biggest Nuclear Energy Producers
-

 Misc2 weeks ago
How Hard Is It to Get Into an Ivy League School?
-

 Debt2 weeks ago
How Debt-to-GDP Ratios Have Changed Since 2000