

By embracing uncertainty and making timely pivots, we visualize the bizarre origin stories of the most successful tech companies today.


The Dow Jones Industrial Average is constantly evolving. This chart tracks which companies have come and gone since the inception of the index in 1928.
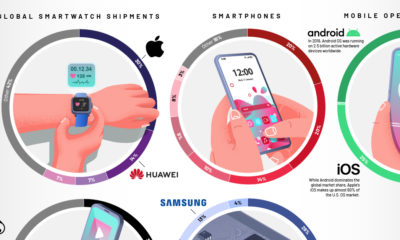

This graphic provides a snapshot of the leading brands currently dominating the personal tech market across the globe.


Podcasting is now a billion dollar industry, attracting big names and audiences to match. Here's a global look at the top podcasts on Spotify.
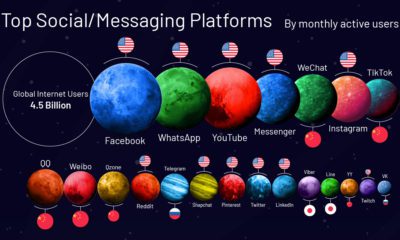

Nearly half the world has tapped into the social media universe. Monthly Active Users (MAUs) quantifies the success of these giant platforms.
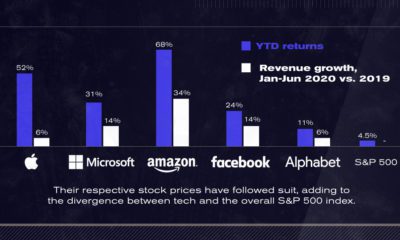

After a strong start to 2020, U.S. tech giants continue to advance to unprecedented highs. The Big Five now account for 25% of the S&P 500.
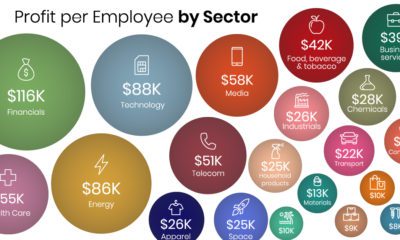

The U.S. companies on the Fortune 500 boast $1.2 trillion in combined profit—but which bring in the best and worst profit per employee?
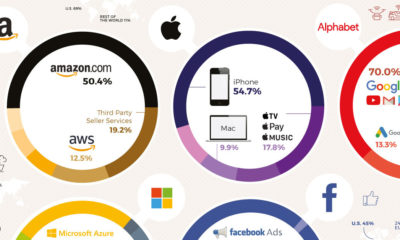

The big five tech companies generate almost $900 billion in revenues combined, more than the GDP of four of the G20 nations. Here's how they earn...
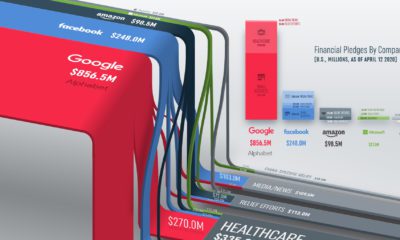

Breaking down the $1.25 billion in funding announced by Big Tech companies to fight the pandemic.
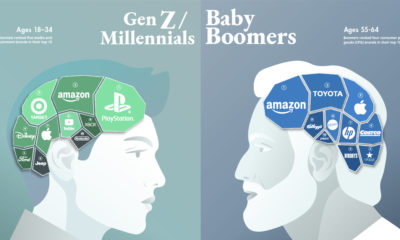

Can a brand transcend time and be all things to all people? This graphic seeks to find out by visualizing the most loved brands by generation.


