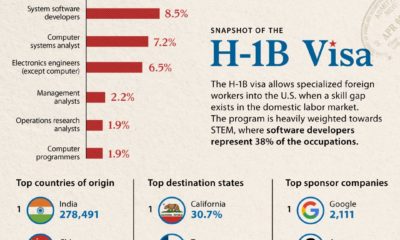

This infographic covers all the key charts and data for the H1-B visa, which grants foreign skilled workers employment in the U.S.
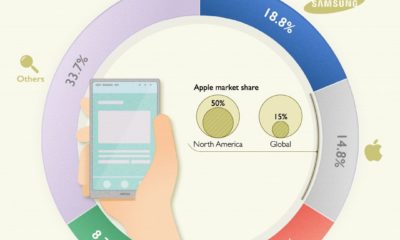

Worldwide smartphone sales decreased by 12% in 2020, but sales are expected to bounce back this year. Will Samsung remain the top dog?
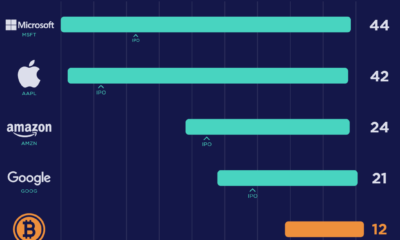

Bitcoin is now part of a select very few assets that hold a market cap greater than $1 trillion. How long did it take to get...
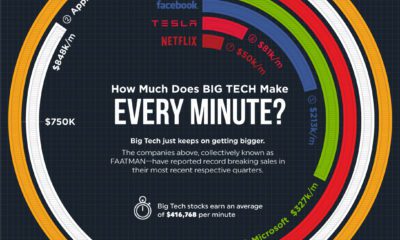

Big Tech just keeps on getting bigger. How much do the FAATMAN companies generate in revenues per minute?
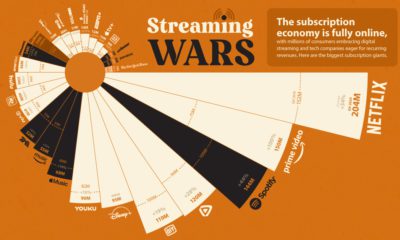

From Netflix and Disney+ to Spotify and Apple Music, we rank the streaming services with the most monthly paid subscriptions.
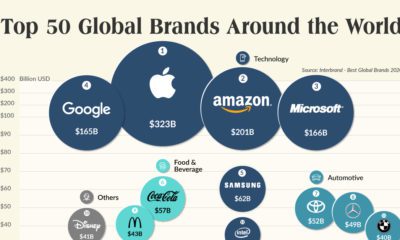

This graphic showcases 2020's top 50 most valuable global brands and explores how COVID-19 has triggered a brand shift with huge implications.
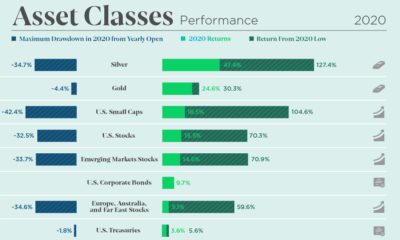

The markets were volatile but offered great opportunity in 2020. See how every asset class, currency, and S&P 500 sector performed over the year.


This graphic compares consumers’ most loved brands before the COVID-19 pandemic to their most loved brands during the pandemic.
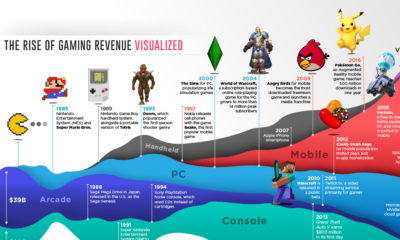

Visualizing 50 years of gaming history, from the first wave of arcades and home consoles to a tsunami of mobile gaming.


By embracing uncertainty and making timely pivots, we visualize the bizarre origin stories of the most successful tech companies today.


