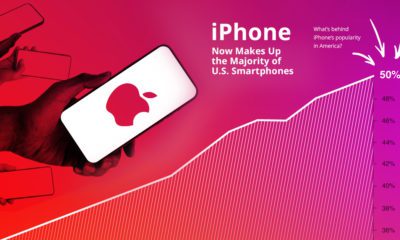

Apple's flagship device has captured a modest 16% of the global market, and Android dominates globally. Why do so many Americans keep buying iPhones?
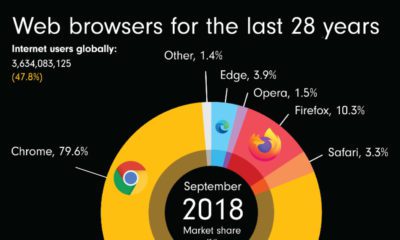

This animation shows the evolution of web browser market share since 1994, showing the rise and fall of various internet portals.
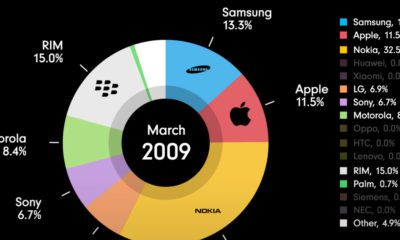

This animation chronicles the evolution of the mobile phone market, showing the rise and fall of various mobile phone manufacturers.
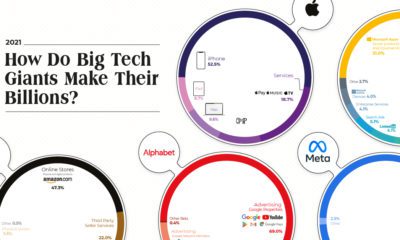

The Big Five tech companies made $1.4 trillion in revenue combined—more than Mexico’s entire GDP. Here's how they earned it all.
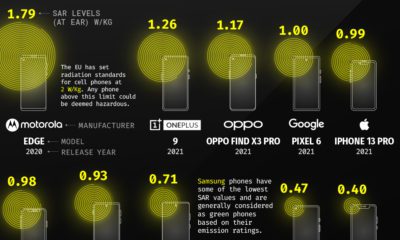

The parameter used to measure phone radiation emissions is the SAR value. Here we visualize the SAR values of some popular smartphones.
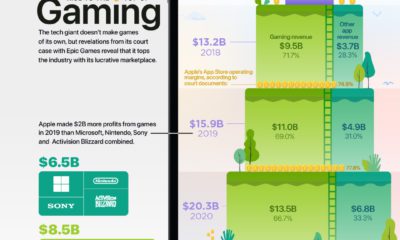

In 2020, Apple generated an estimated $13.5 billion dollars in gaming revenue, despite the fact it doesn't make any games or gaming consoles.
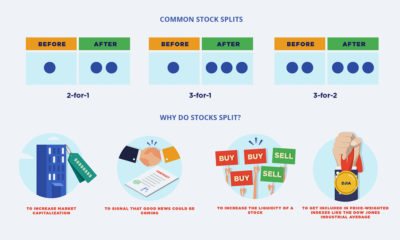

If companies want their stock price to rise, why would they want to split it, effectively lowering the price? This infographic explains why.
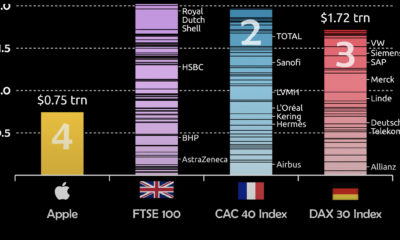

Apple's market cap recently hit $3 trillion. To put that scale into context, this visualization compares Apple to European indexes.
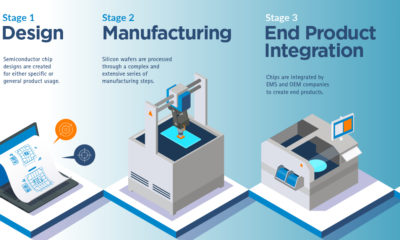

From smartphones to cars and factories, the semiconductor supply chain powers our entire digital economy.
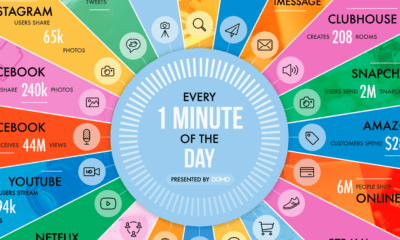

A lot can happen in an internet minute. This stat-heavy graphic looks at the epic numbers behind the online services billions use every day.


 Creator Program