Technology
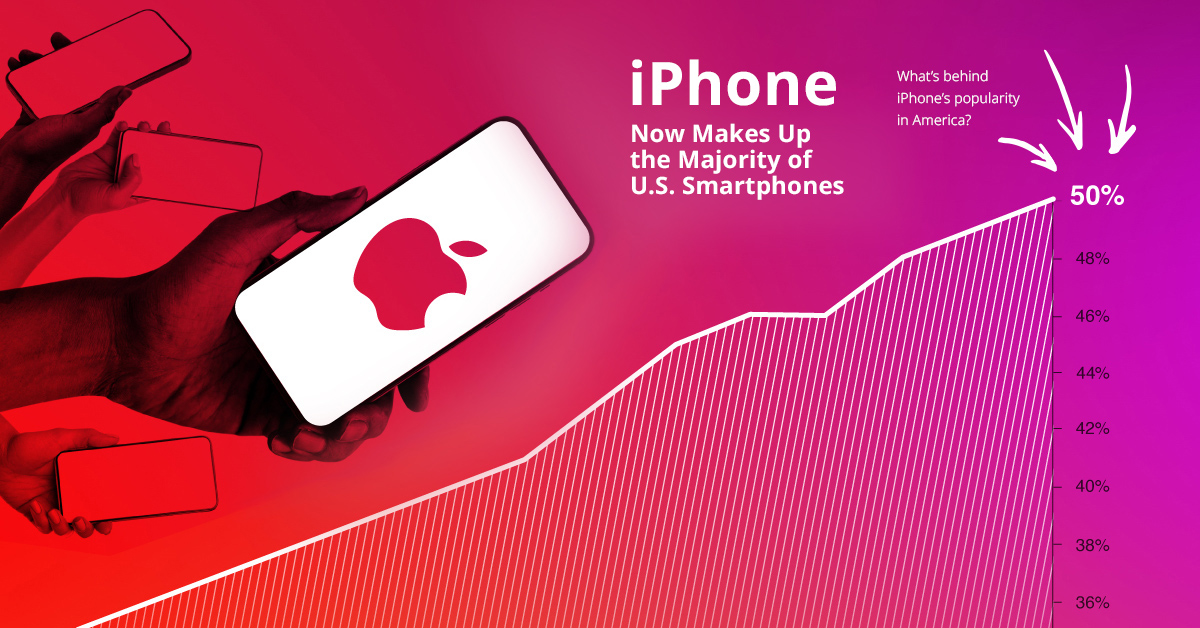
iPhone Now Makes Up the Majority of U.S. Smartphones


iPhone Now Makes Up the Majority of U.S. Smartphones
One of the most iconic tech moments of the 21st century is Steve Jobs, in his signature black turtleneck, holding up a small device: the iPhone. Since that introduction at the 2007 Macworld conference in San Francisco, iPhone has gone on to become a global phenomenon, with over 1.2 billion units now sold around the world.
Today, the smartphone market is a fiercely competitive space.
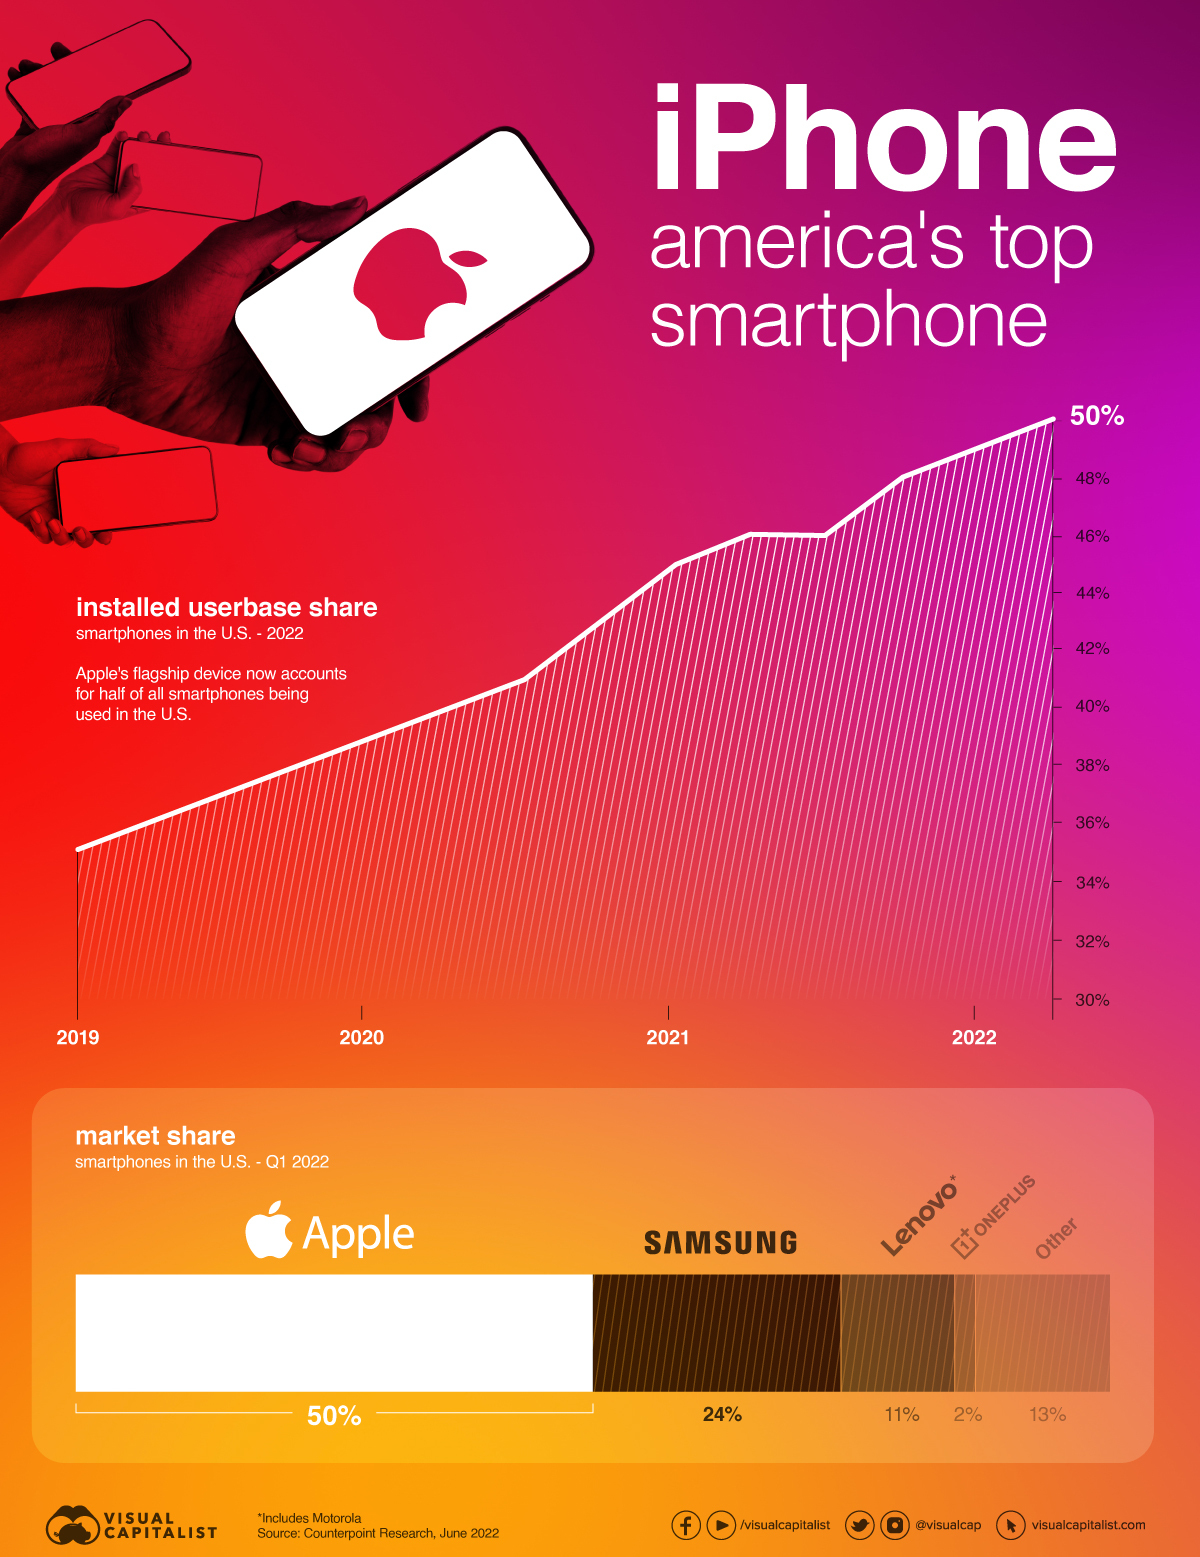
On a global scale, iPhone has carved out a respectable 16% of the smartphone market. In the U.S., however, the iPhone has managed to win the hearts and minds of more consumers. New data from Counterpoint Research via FT notes that iPhones now make up 50% of the overall installed user base* in the United States.
With a plethora of smartphone brands available to American consumers—and many at lower price points—what is it that makes this brand so popular?
iPhone: The Apple of America’s Eye
Experts point to a number of reasons why Apple’s flagship device outperforms in the U.S. compared to other markets.
- Apple has the highest brand loyalty of any major smartphone maker. 9 in 10 U.S. iPhone users plan to purchase an iPhone as their next device.
- iPhones appear to depreciate at a slower rate than other devices
- Broadly speaking, consumers in the U.S. have less price sensitivity than consumers in many other countries.
- Apple has been vocal in their messaging about protecting user privacy and data, and that message appears to be resonating with consumers.
This last point is worth digging into in more detail.
Winning the Privacy War
Personal data protection and cybersecurity have become mainstream concerns in recent years, and Apple has made security a priority.
Of course, security breaches can and do occur, regardless of what device is being used. That said, a recent survey by Beyond Identity indicates that iPhone users were less likely to be victims of security breaches, and were more likely to recover data in the event of a breach.
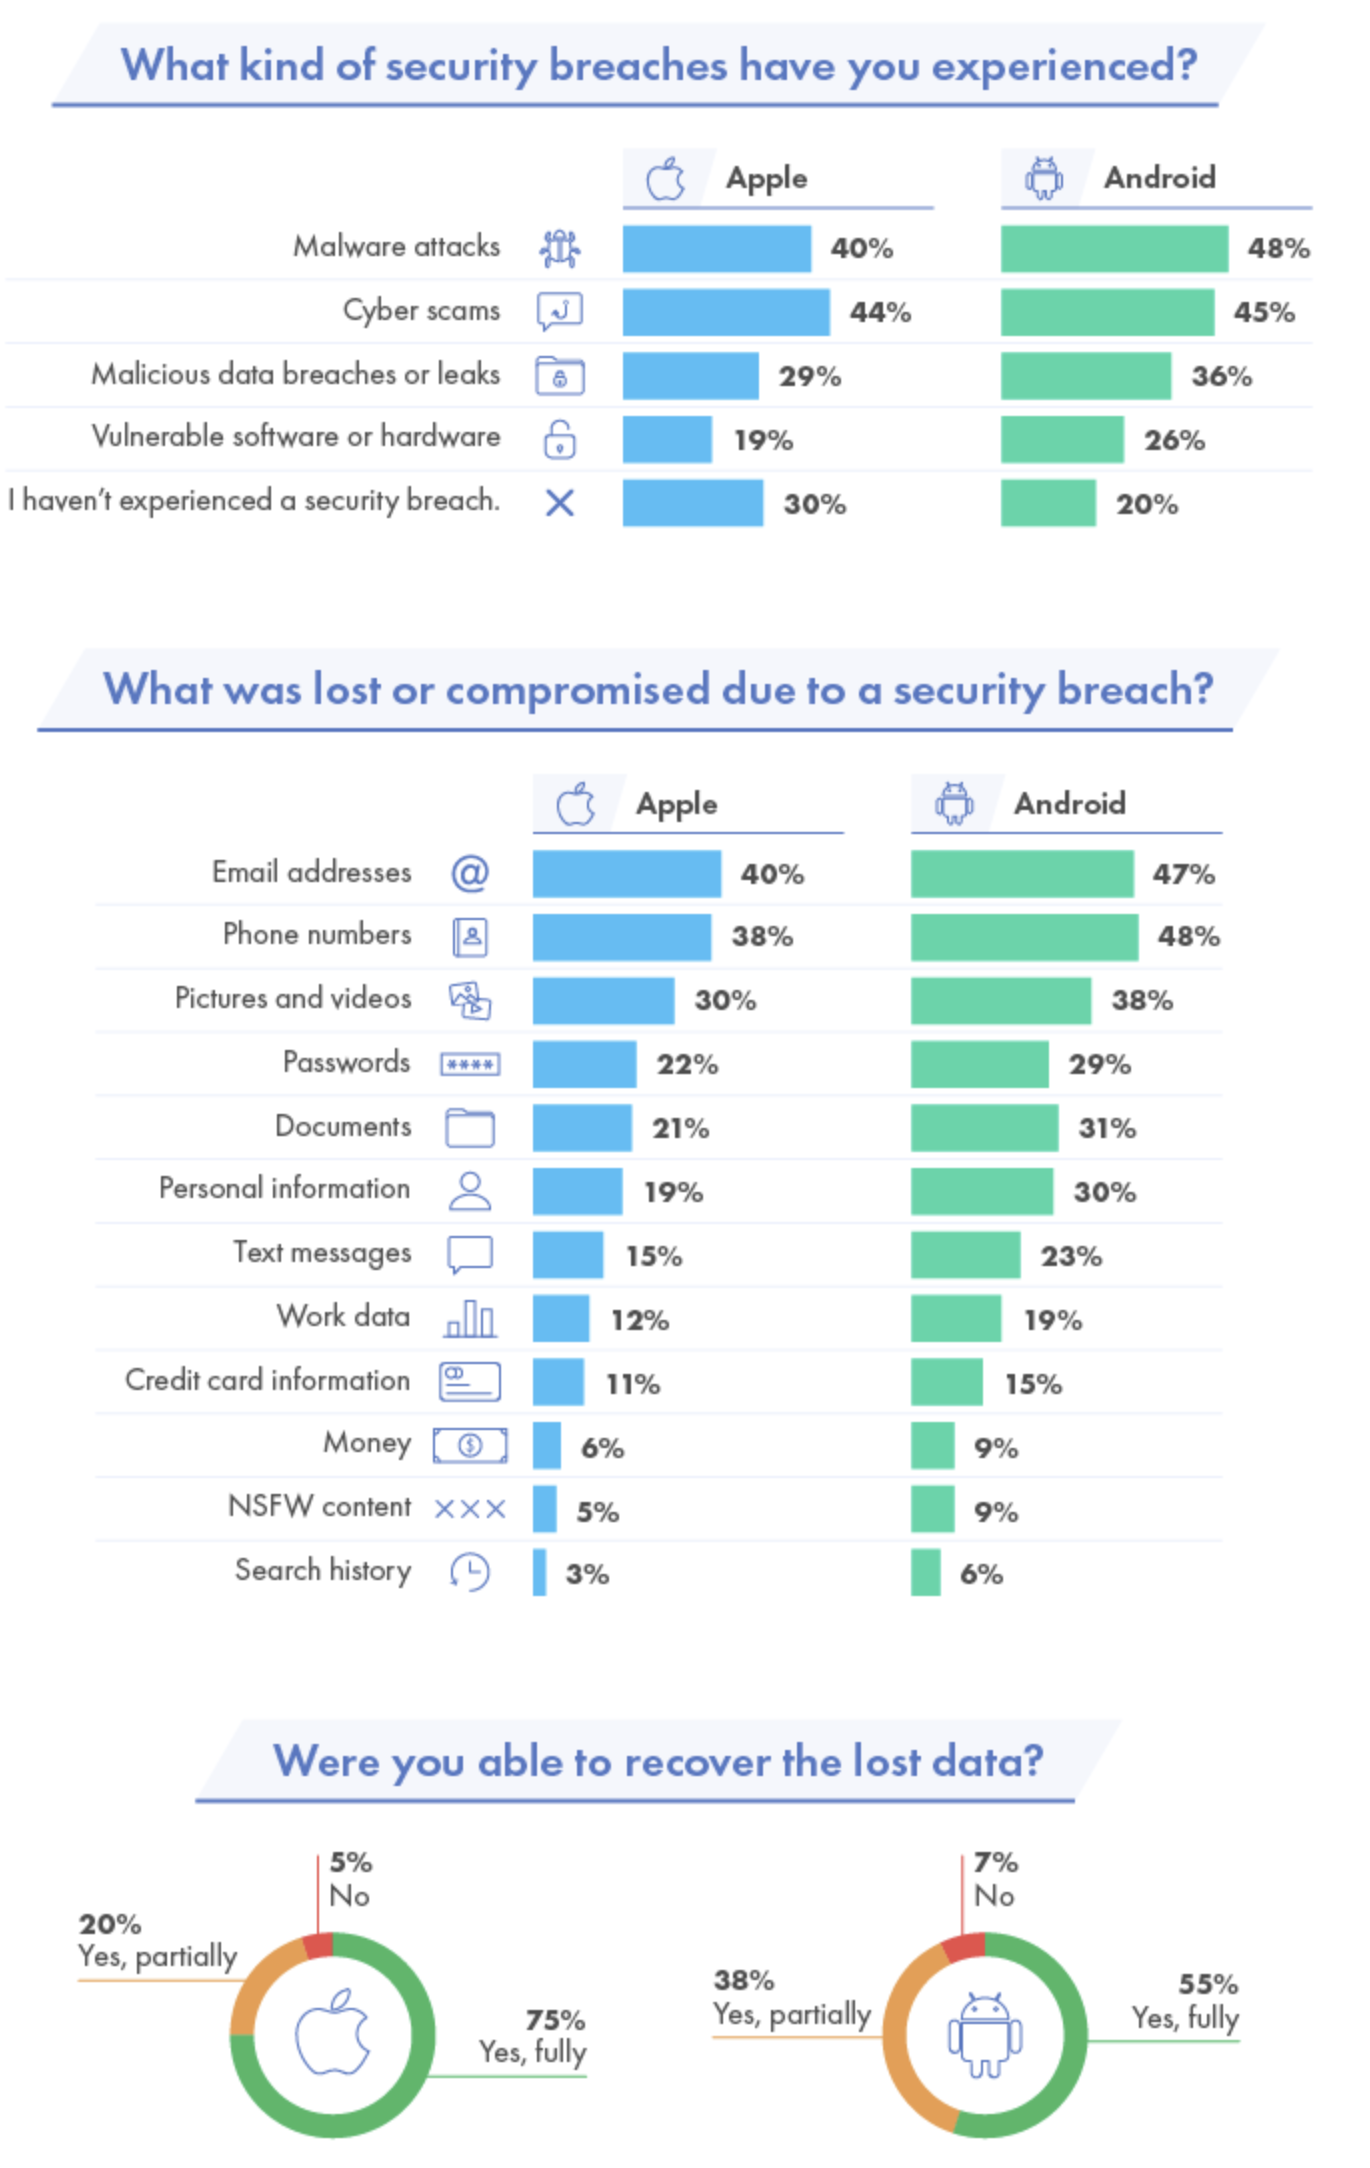
The survey also points out that iPhone users were less likely to have sensitive data, such as images and videos, credit card information, passwords, and personal data compromised when breaches occurred.
These findings aside, Apple has also been bullish on branding its devices as safe and secure. The “Privacy. That’s iPhone.” campaign launched in 2019, and most recently, Apple has put the data broker industry in its crosshairs through a new series of ad spots.
Simply put: whether or not iPhone is more secure than other devices, Apple has used its marketing muscle to sway public opinion at a time when Americans are focused on privacy. And based on these latest installed user base numbers, that strategy appears to be paying off.


Technology
All of the Grants Given by the U.S. CHIPS Act
Intel, TSMC, and more have received billions in subsidies from the U.S. CHIPS Act in 2024.


All of the Grants Given by the U.S. CHIPS Act
This was originally posted on our Voronoi app. Download the app for free on iOS or Android and discover incredible data-driven charts from a variety of trusted sources.
This visualization shows which companies are receiving grants from the U.S. CHIPS Act, as of April 25, 2024. The CHIPS Act is a federal statute signed into law by President Joe Biden that authorizes $280 billion in new funding to boost domestic research and manufacturing of semiconductors.
The grant amounts visualized in this graphic are intended to accelerate the production of semiconductor fabrication plants (fabs) across the United States.
Data and Company Highlights
The figures we used to create this graphic were collected from a variety of public news sources. The Semiconductor Industry Association (SIA) also maintains a tracker for CHIPS Act recipients, though at the time of writing it does not have the latest details for Micron.
| Company | Federal Grant Amount | Anticipated Investment From Company |
|---|---|---|
| 🇺🇸 Intel | $8,500,000,000 | $100,000,000,000 |
| 🇹🇼 TSMC | $6,600,000,000 | $65,000,000,000 |
| 🇰🇷 Samsung | $6,400,000,000 | $45,000,000,000 |
| 🇺🇸 Micron | $6,100,000,000 | $50,000,000,000 |
| 🇺🇸 GlobalFoundries | $1,500,000,000 | $12,000,000,000 |
| 🇺🇸 Microchip | $162,000,000 | N/A |
| 🇬🇧 BAE Systems | $35,000,000 | N/A |
BAE Systems was not included in the graphic due to size limitations
Intel’s Massive Plans
Intel is receiving the largest share of the pie, with $8.5 billion in grants (plus an additional $11 billion in government loans). This grant accounts for 22% of the CHIPS Act’s total subsidies for chip production.
From Intel’s side, the company is expected to invest $100 billion to construct new fabs in Arizona and Ohio, while modernizing and/or expanding existing fabs in Oregon and New Mexico. Intel could also claim another $25 billion in credits through the U.S. Treasury Department’s Investment Tax Credit.
TSMC Expands its U.S. Presence
TSMC, the world’s largest semiconductor foundry company, is receiving a hefty $6.6 billion to construct a new chip plant with three fabs in Arizona. The Taiwanese chipmaker is expected to invest $65 billion into the project.
The plant’s first fab will be up and running in the first half of 2025, leveraging 4 nm (nanometer) technology. According to TrendForce, the other fabs will produce chips on more advanced 3 nm and 2 nm processes.
The Latest Grant Goes to Micron
Micron, the only U.S.-based manufacturer of memory chips, is set to receive $6.1 billion in grants to support its plans of investing $50 billion through 2030. This investment will be used to construct new fabs in Idaho and New York.

-

 Education1 week ago
How Hard Is It to Get Into an Ivy League School?
-

 Technology2 weeks ago
Ranked: Semiconductor Companies by Industry Revenue Share
-

 Markets2 weeks ago
Ranked: The World’s Top Flight Routes, by Revenue
-

 Demographics2 weeks ago
Population Projections: The World’s 6 Largest Countries in 2075
-

 Markets2 weeks ago
The Top 10 States by Real GDP Growth in 2023
-

 Demographics2 weeks ago
The Smallest Gender Wage Gaps in OECD Countries
-

 Economy2 weeks ago
Where U.S. Inflation Hit the Hardest in March 2024
-

 Green2 weeks ago
Top Countries By Forest Growth Since 2001