Technology
How Much Radiation is Emitted by Popular Smartphones?


Radiation Emissions of Popular Smartphones
Smartphones have become an integral part of our everyday lives. From work and school to daily tasks, these handheld devices have brought everything into the palm of our hands.
Most people spend 5-6 hours on their phones each day. And, given that our phones emit a tiny amount of radiation, we’re exposing ourselves to radiation for hours each day.
But different phones emit different amounts of radiation.
With the help of data collected by the German Federal Office of Radiation Protection, we visualize the radiation emissions of some popular smartphones in the market today.
Radiation and SAR Values of Smartphones
Smartphones and other mobile devices emit tiny amounts of radiofrequency (RF) radiation. Humans can absorb this radiation when the smartphone is being used or is lying dormant anywhere near their bodies.
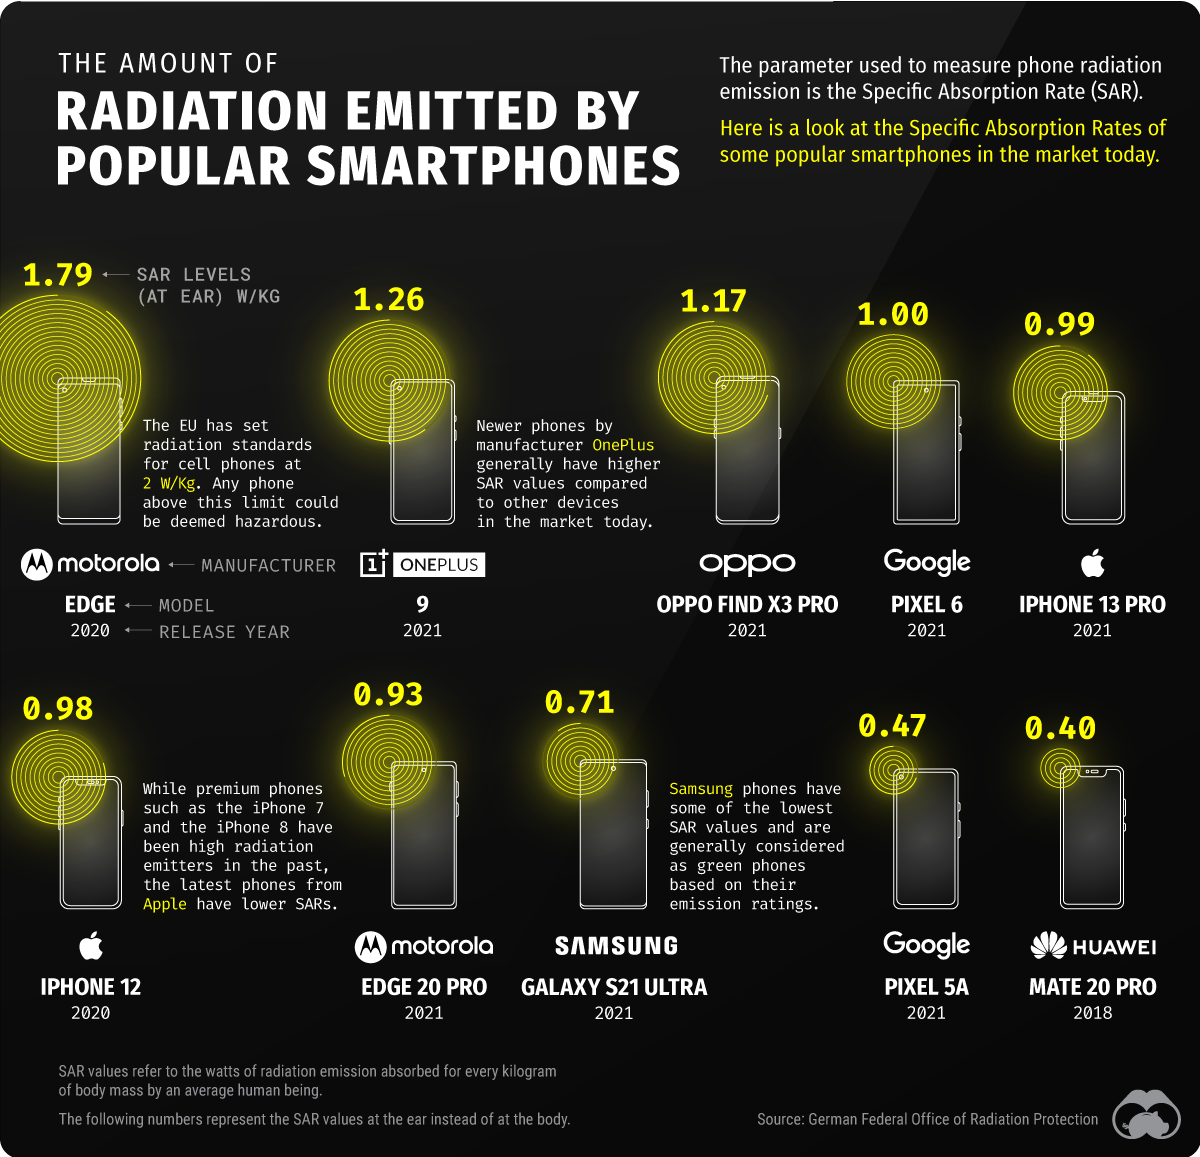
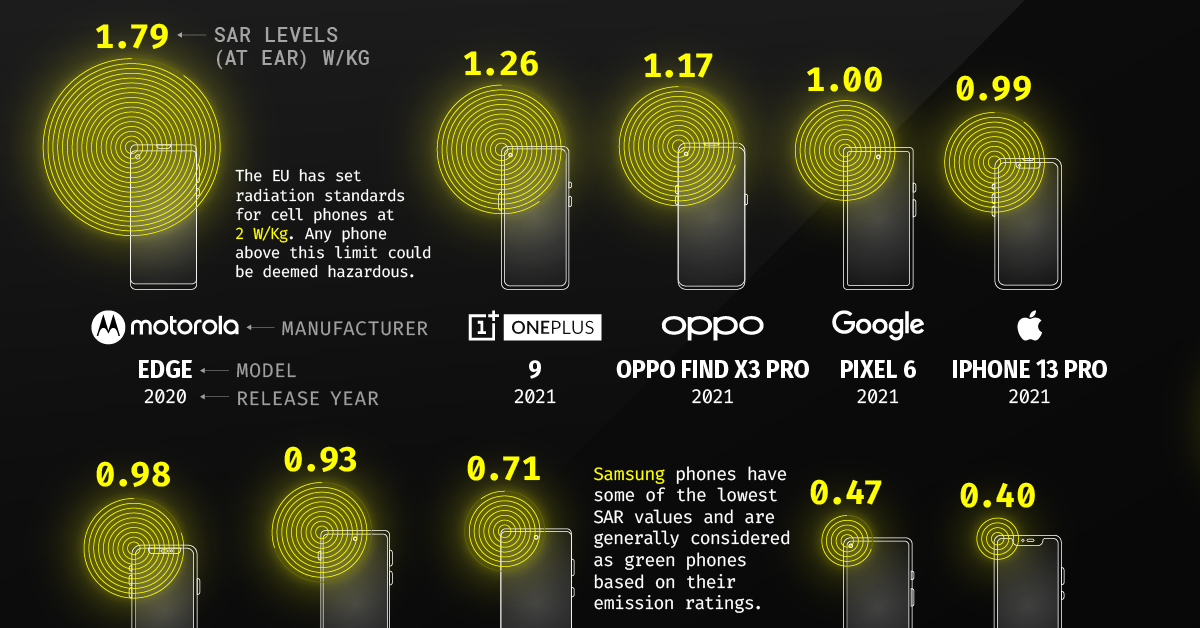
The parameter used to measure phone radiation emissions is the Specific Absorption Rate (SAR). It is the unit of measurement that represents the quantity of electromagnetic energy absorbed by the body when using a mobile device.
The Council of the European Union has set radiation standards for cell phones at 2 watts per kilogram, measured over the 10 grams of tissue that is absorbing the most signal.
SAR values are calculated at the ear (speaking on the phone) and at the body (kept in your pocket). For the purposes of this article, we’ve used the former calculations.
Smartphones With the Highest Levels of Radiation Emissions
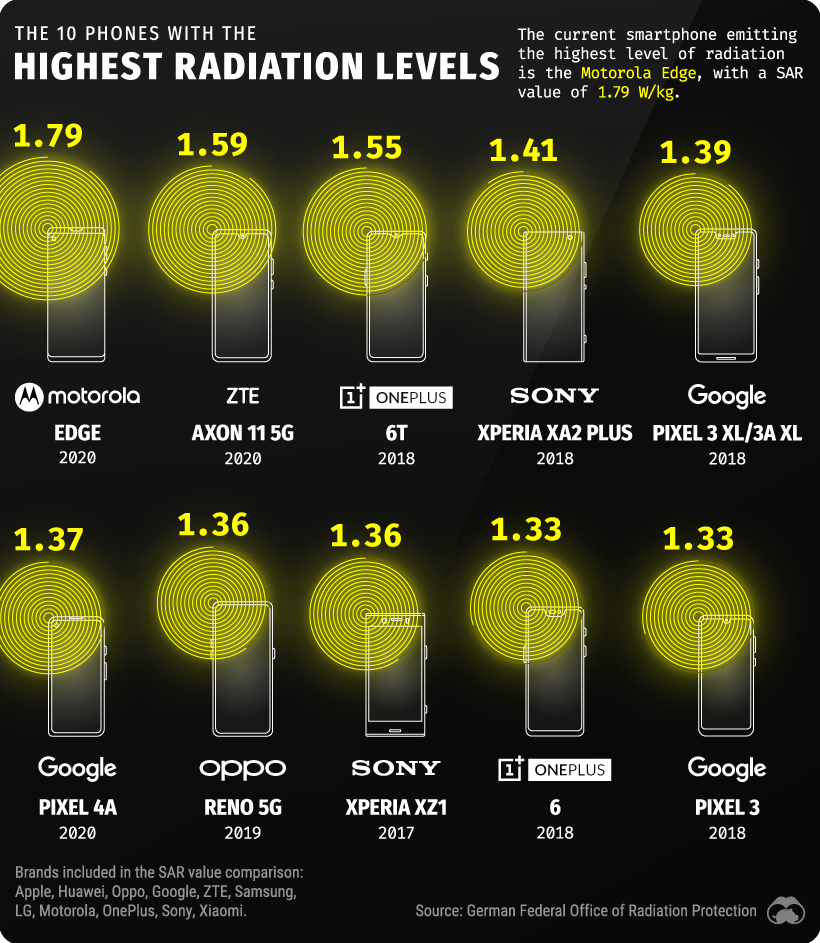
The Motorola Edge has the highest radiation emission with a SAR value of 1.79 watts of radiation per kilogram. That’s significantly higher than most other smartphone models in the market today and close to the limits set by the EU for cellphones.
Coming in second is the Axon 11 5G by ZTE with 1.59, followed by the OnePlus 6T at a close third with 1.55 W/kg. The Sony Experia AX2 Plus with 1.41 and the Google Pixel 3 XL and 3A XL at 1.39 round out the top five.
Here is a look at the 10 smartphones that emit the highest level of radiation:
Now that we have detailed the worst offenders let’s look at the smartphones with the lowest levels of radiation emissions.
Smartphones With the Lowest Levels of Radiation Emissions
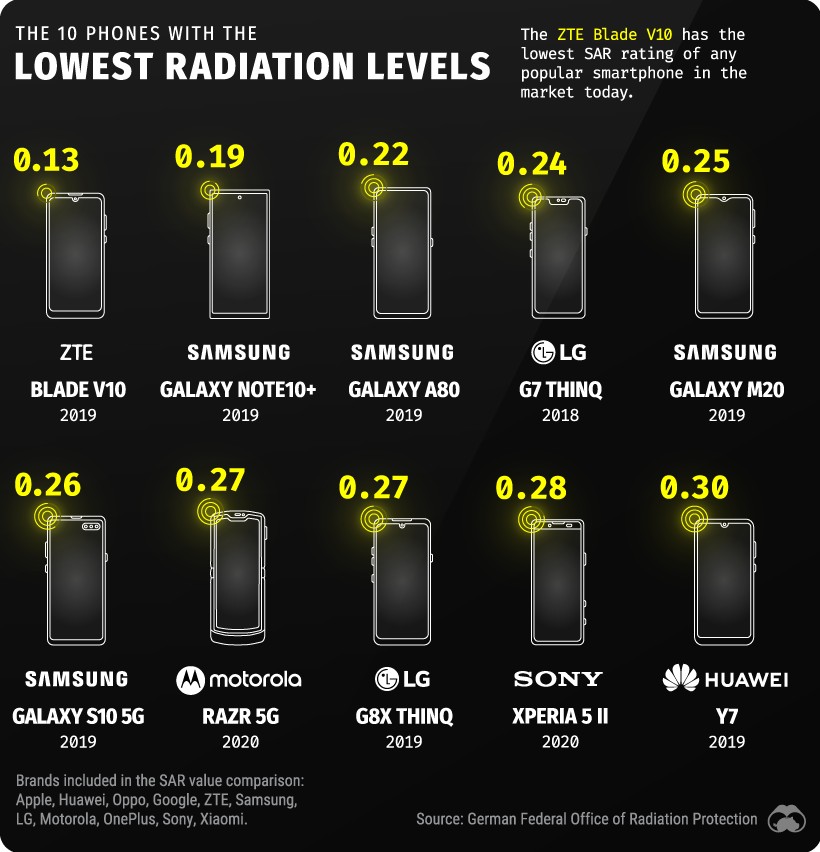
The smartphone with the lowest SAR value is the ZTE Blade V10, with 0.13 watts of radiation per kilogram.
Mobile devices by Samsung carry some of the least radiation risks. The company has four phones considered to be the best in the category. The Galaxy Note 10+ is the best model in their line-up, emitting a meager 0.19 watts per kilogram.
Here is a look at the 10 smartphones that emit the lowest levels of radiation:
There is currently no significant research proving the harmful effects of phone radiation.
Despite this, people who are in contact with their devices for extended periods can at least quantify their radiation exposure and make choices about which brands serve their needs.


Technology
All of the Grants Given by the U.S. CHIPS Act
Intel, TSMC, and more have received billions in subsidies from the U.S. CHIPS Act in 2024.


All of the Grants Given by the U.S. CHIPS Act
This was originally posted on our Voronoi app. Download the app for free on iOS or Android and discover incredible data-driven charts from a variety of trusted sources.
This visualization shows which companies are receiving grants from the U.S. CHIPS Act, as of April 25, 2024. The CHIPS Act is a federal statute signed into law by President Joe Biden that authorizes $280 billion in new funding to boost domestic research and manufacturing of semiconductors.
The grant amounts visualized in this graphic are intended to accelerate the production of semiconductor fabrication plants (fabs) across the United States.
Data and Company Highlights
The figures we used to create this graphic were collected from a variety of public news sources. The Semiconductor Industry Association (SIA) also maintains a tracker for CHIPS Act recipients, though at the time of writing it does not have the latest details for Micron.
| Company | Federal Grant Amount | Anticipated Investment From Company |
|---|---|---|
| 🇺🇸 Intel | $8,500,000,000 | $100,000,000,000 |
| 🇹🇼 TSMC | $6,600,000,000 | $65,000,000,000 |
| 🇰🇷 Samsung | $6,400,000,000 | $45,000,000,000 |
| 🇺🇸 Micron | $6,100,000,000 | $50,000,000,000 |
| 🇺🇸 GlobalFoundries | $1,500,000,000 | $12,000,000,000 |
| 🇺🇸 Microchip | $162,000,000 | N/A |
| 🇬🇧 BAE Systems | $35,000,000 | N/A |
BAE Systems was not included in the graphic due to size limitations
Intel’s Massive Plans
Intel is receiving the largest share of the pie, with $8.5 billion in grants (plus an additional $11 billion in government loans). This grant accounts for 22% of the CHIPS Act’s total subsidies for chip production.
From Intel’s side, the company is expected to invest $100 billion to construct new fabs in Arizona and Ohio, while modernizing and/or expanding existing fabs in Oregon and New Mexico. Intel could also claim another $25 billion in credits through the U.S. Treasury Department’s Investment Tax Credit.
TSMC Expands its U.S. Presence
TSMC, the world’s largest semiconductor foundry company, is receiving a hefty $6.6 billion to construct a new chip plant with three fabs in Arizona. The Taiwanese chipmaker is expected to invest $65 billion into the project.
The plant’s first fab will be up and running in the first half of 2025, leveraging 4 nm (nanometer) technology. According to TrendForce, the other fabs will produce chips on more advanced 3 nm and 2 nm processes.
The Latest Grant Goes to Micron
Micron, the only U.S.-based manufacturer of memory chips, is set to receive $6.1 billion in grants to support its plans of investing $50 billion through 2030. This investment will be used to construct new fabs in Idaho and New York.

-

 Education1 week ago
How Hard Is It to Get Into an Ivy League School?
-

 Technology2 weeks ago
Ranked: Semiconductor Companies by Industry Revenue Share
-

 Markets2 weeks ago
Ranked: The World’s Top Flight Routes, by Revenue
-

 Demographics2 weeks ago
Population Projections: The World’s 6 Largest Countries in 2075
-

 Markets2 weeks ago
The Top 10 States by Real GDP Growth in 2023
-

 Demographics2 weeks ago
The Smallest Gender Wage Gaps in OECD Countries
-

 Economy2 weeks ago
Where U.S. Inflation Hit the Hardest in March 2024
-

 Green2 weeks ago
Top Countries By Forest Growth Since 2001