
This visual heatmap of unemployment claims by state highlights New York, California, and Alaska leading the country by a wide...


click for more →


Scan with your phone's camera or QR code app to view
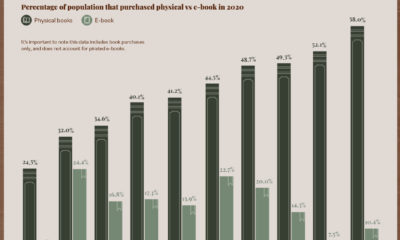

When e-books hit the mainstream in the early 2000s, many predicted they'd eventually make print books obsolete. So far, that prediction has not come true.
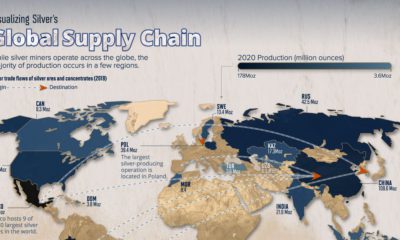

Nearly 50% of global silver production comes from South and Central America. Here's a look at the global silver supply chain.
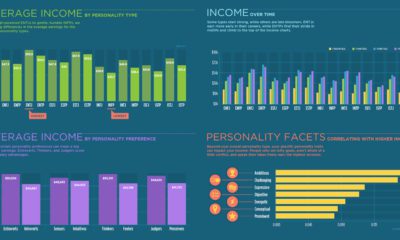

Can your Myers–Briggs personality type impact how much you make? See for yourself with this breakdown of average income for all 16 personality types.
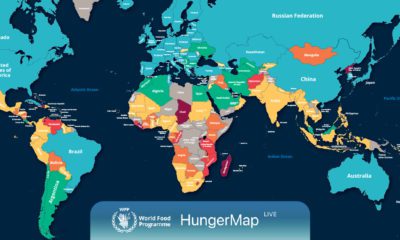

Every day, hunger affects more than 700 million people. This live map from the UN highlights where hunger is hitting hardest around the world.
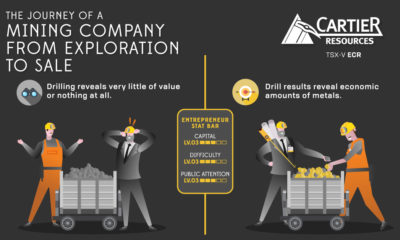

Visualizing the Journey of a Mining Entrepreneur Mining may be an industry nearly as old as humankind itself, but the process of how a patch of...
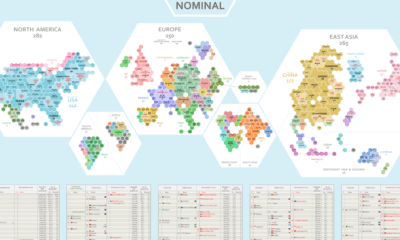

Where does the world's economic activity take place? This cartogram shows the $94 trillion global economy divided into 1,000 hexagons.
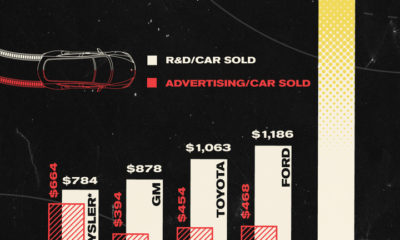

How much does Tesla spend on a per car basis on innovation and marketing, compared to more traditional automakers?
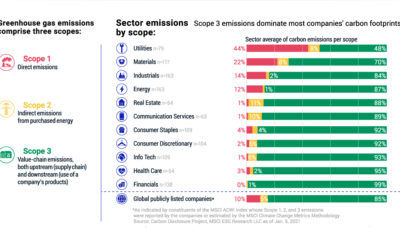

Companies are setting net-zero carbon targets more than ever. But how much is just talk? Here's how to determine their quality.
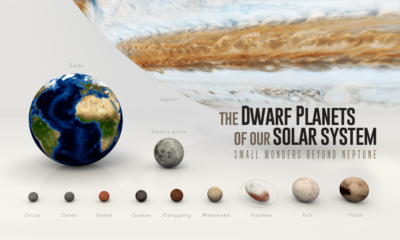

Since dwarf planets started being classified in 2005, nine have been recognized. Here we visually introduce the dwarf planets in our solar system.
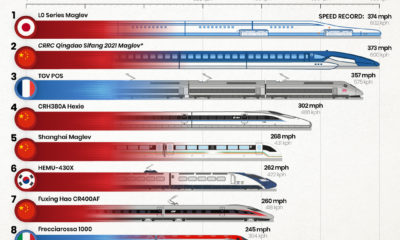

Which country has the fastest trains in the world, and how fast can they go?
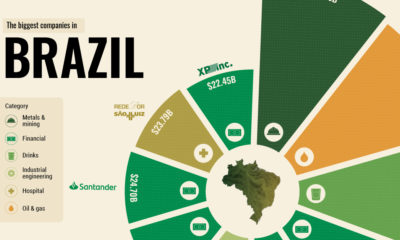

What drives some of the world’s emerging economies? From natural resources to giant banks, here are the top 10 biggest companies in Brazil.


Many children are misdiagnosed with OCD or Tourettes when they really suffer from PANS or PANDAS. Here's how to tell if your child is at risk.


COVID-19 hit the global economy hard, but some companies thrived amidst the chaos. Here are the top 100 most valuable brands of 2021.
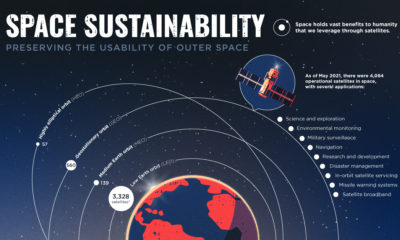

Space junk and orbital crowding are threatening the future of space activities. Learn more about space sustainability in this infographic.
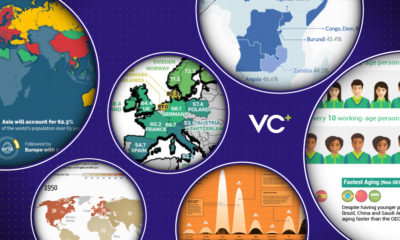

This month, we look at some of the top creators of data-driven visuals, while also tackling topics like climate change and an aging population.
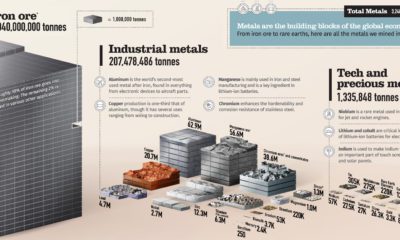

From iron ore to rare earths, over 3 billion tonnes of metals are mined each year. This chart shows them all on a relative scale.
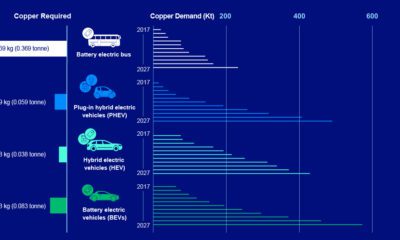

As the world moves towards renewable energy technologies, copper will remain the most widely used metal. Here’s a snapshot of copper’s role in a low-carbon economy...


