Datastream
Comparing Tesla’s Spending on R&D and Marketing Per Car to Other Automakers
The Briefing
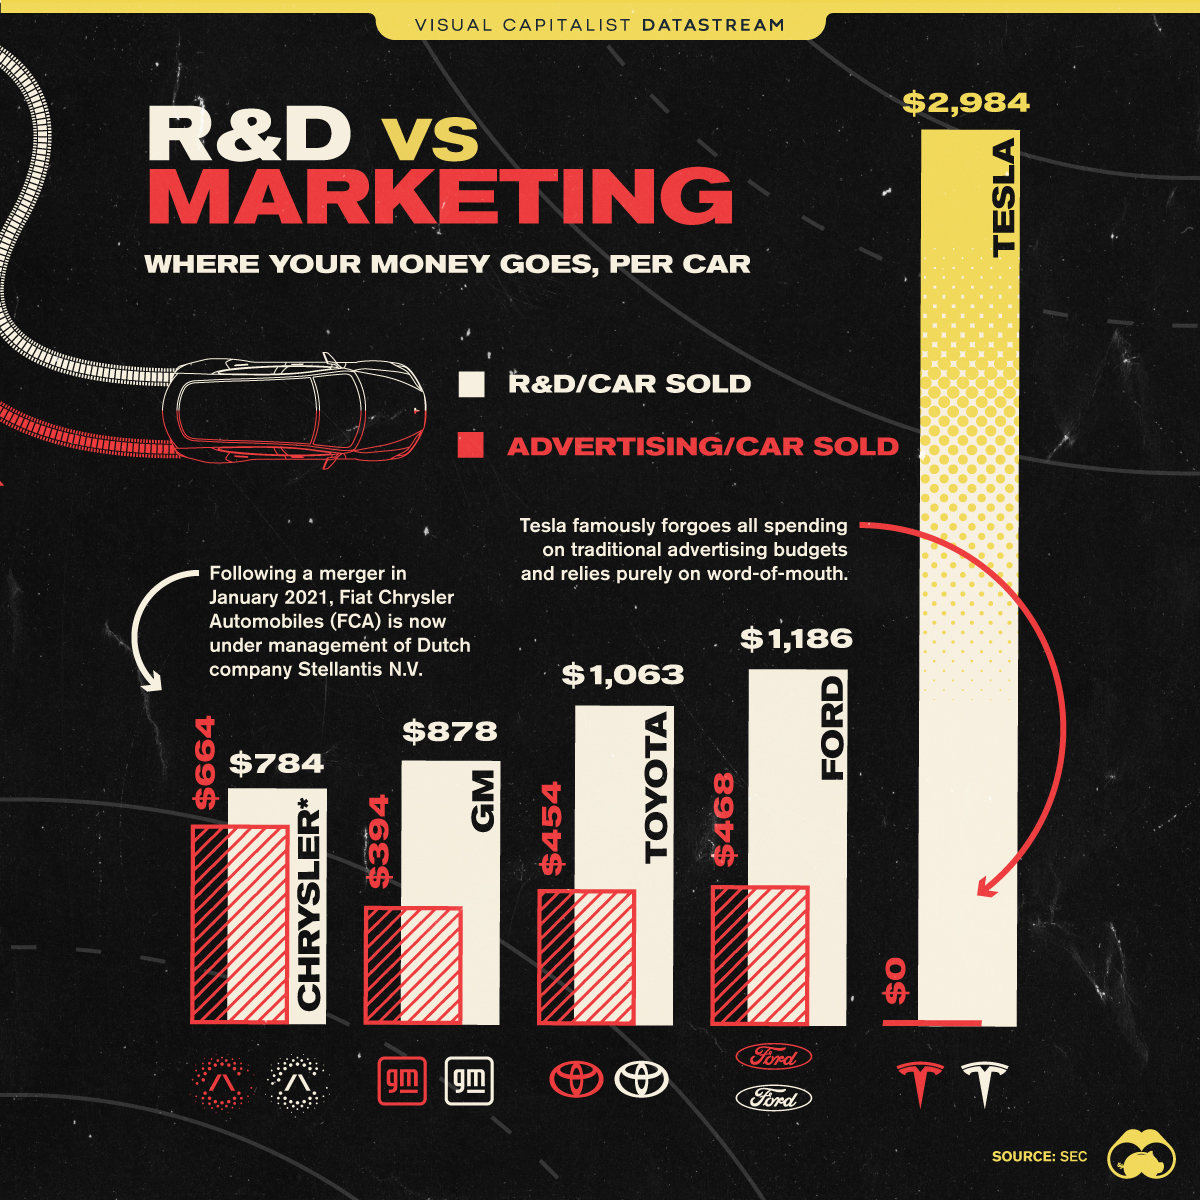
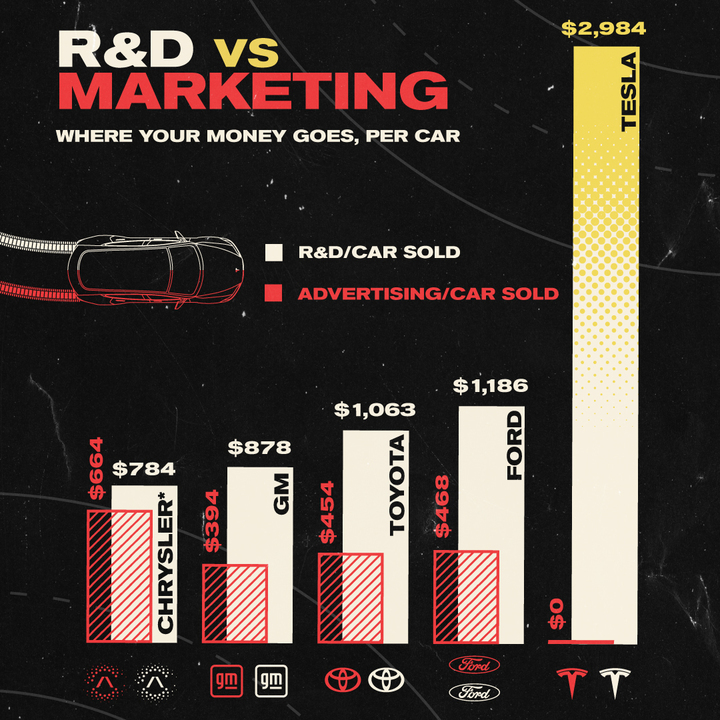
- Tesla spends $0 of its budget on advertising, but instead spends a dramatic amount on research and development (R&D)
Tesla’s Spending Per Car Sold vs. Other Automakers
It’s often said that word of mouth is the best form of advertising.
In the case of Tesla and their rapid ascent to the top of the global automobile business, this might be true. After all, the electric vehicle company somehow manages to spend $0 on advertising year after year, despite the fact that marketing is typically a significant expense line item for most other auto manufacturers.
On the flip side, Tesla is spending an average of $2,984 per car sold on research and development (R&D)—often triple the amount of other traditional automakers.
| Automaker | R&D spend per car sold | Ad spend per car sold | R&D per dollar of advertising |
|---|---|---|---|
| Tesla | $2,984 | $0 | $0 |
| Ford | $1,186 | $468 | $2.53 |
| Toyota | $1,063 | $454 | $2.34 |
| General Motors | $878 | $394 | $2.22 |
| Chrysler | $784 | $664 | $1.18 |
On this per vehicle sold basis, Tesla’s $2,984 in R&D spend per car is far greater than that of other car manufacturers. It’s even higher than the collective amount going to R&D per car from three of the other automakers (Ford, GM, and Chrysler) combined.
When it comes to advertising, the average spend among traditional automakers is $495 per vehicle. And while Tesla technically spends nothing on advertising, the company is a marketing machine that is rated as the world’s fastest growing brand, and Tesla often dominates press mentions and social media chatter.
Capital Allocation: R&D and Advertising
The balance of expenditures between R&D and advertising is part of capital allocation, a decision every business needs to make. Generally speaking, more R&D can improve and advance the quality of either your goods or service, relative to your competitors. If executed correctly, it has the potential to lead to greater pricing power that will reflect in the margins.
In contrast, advertising can spread awareness and promote the business. But it’s a tricky balance that isn’t always easy to get right.
While capital allocation is vital, one factor that differentiates Tesla from the rest, is Elon Musk himself. With over 60 million followers on Twitter, his wild popularity has no doubt aided in Tesla’s brand recognition, where they’ve arguably become synonymous with the electric vehicle revolution.
Automobiles Of Tomorrow
For Americans, 85% still use an automobile as their primary method of transportation to work. As a result, automobiles will likely undergo a serious shake up as the world continues on its path towards a greener future.
With increasing investments made in the electric vehicle space—poised to be worth a trillion dollar market by 2028—how will R&D and advertising budgets of tomorrow look for major automobile companies?
Where does this data come from?
Source: 10-K Filings
Notes: Data covers automobile figures for 2020


Datastream
Can You Calculate Your Daily Carbon Footprint?
Discover how the average person’s carbon footprint impacts the environment and learn how carbon credits can offset your carbon footprint.


The Briefing
- A person’s carbon footprint is substantial, with activities such as food consumption creating as much as 4,500 g of CO₂ emissions daily.
- By purchasing carbon credits from Carbon Streaming Corporation, you can offset your own emissions and fund positive climate action.
Your Everyday Carbon Footprint
While many large businesses and countries have committed to net-zero goals, it is essential to acknowledge that your everyday activities also contribute to global emissions.
In this graphic, sponsored by Carbon Streaming Corporation, we will explore how the choices we make and the products we use have a profound impact on our carbon footprint.
Carbon Emissions by Activity
Here are some of the daily activities and products of the average person and their carbon footprint, according to Clever Carbon.
| Household Activities & Products | CO2 Emissions (g) |
|---|---|
| 💡 Standard Light Bulb (100 watts, four hours) | 172 g |
| 📱 Mobile Phone Use (195 minutes per day)* | 189 g |
| 👕 Washing Machine (0.63 kWh) | 275 g |
| 🔥 Electric Oven (1.56 kWh) | 675 g |
| ♨️ Tumble Dryer (2.5 kWh) | 1,000 g |
| 🧻 Toilet Roll (2 ply) | 1,300 g |
| 🚿 Hot Shower (10 mins) | 2,000 g |
| 🚙 Daily Commute (one hour, by car) | 3,360 g |
| 🍽️ Average Daily Food Consumption (three meals of 600 calories) | 4,500 g |
| *Phone use based on yearly use of 69kg per the source, Reboxed | |
Your choice of transportation plays a crucial role in determining your carbon footprint. For instance, a 15 km daily commute to work on public transport generates an average of 1,464 g of CO₂ emissions. Compared to 3,360 g—twice the volume for a journey the same length by car.
By opting for more sustainable modes of transport, such as cycling, walking, or public transportation, you can significantly reduce your carbon footprint.
Addressing Your Carbon Footprint
One way to compensate for your emissions is by purchasing high-quality carbon credits.
Carbon credits are used to help fund projects that avoid, reduce or remove CO₂ emissions. This includes nature-based solutions such as reforestation and improved forest management, or technology-based solutions such as the production of biochar and carbon capture and storage (CCS).
While carbon credits offer a potential solution for individuals to help reduce global emissions, public awareness remains a significant challenge. A BCG-Patch survey revealed that only 34% of U.S. consumers are familiar with carbon credits, and only 3% have purchased them in the past.
About Carbon Streaming
By financing the creation or expansion of carbon projects, Carbon Streaming Corporation secures the rights to future carbon credits generated by these sustainable projects. You can then purchase these carbon credits to help fund climate solutions around the world and compensate for your own emissions.
Ready to get involved?
>> Learn more about purchasing carbon credits at Carbon Streaming

-

 Education1 week ago
How Hard Is It to Get Into an Ivy League School?
-

 Technology2 weeks ago
Ranked: Semiconductor Companies by Industry Revenue Share
-

 Markets2 weeks ago
Ranked: The World’s Top Flight Routes, by Revenue
-

 Demographics2 weeks ago
Population Projections: The World’s 6 Largest Countries in 2075
-

 Markets2 weeks ago
The Top 10 States by Real GDP Growth in 2023
-

 Demographics2 weeks ago
The Smallest Gender Wage Gaps in OECD Countries
-

 Economy2 weeks ago
Where U.S. Inflation Hit the Hardest in March 2024
-

 Green2 weeks ago
Top Countries By Forest Growth Since 2001