Datastream
Ranked: The World’s Fastest Growing Brands in 2021
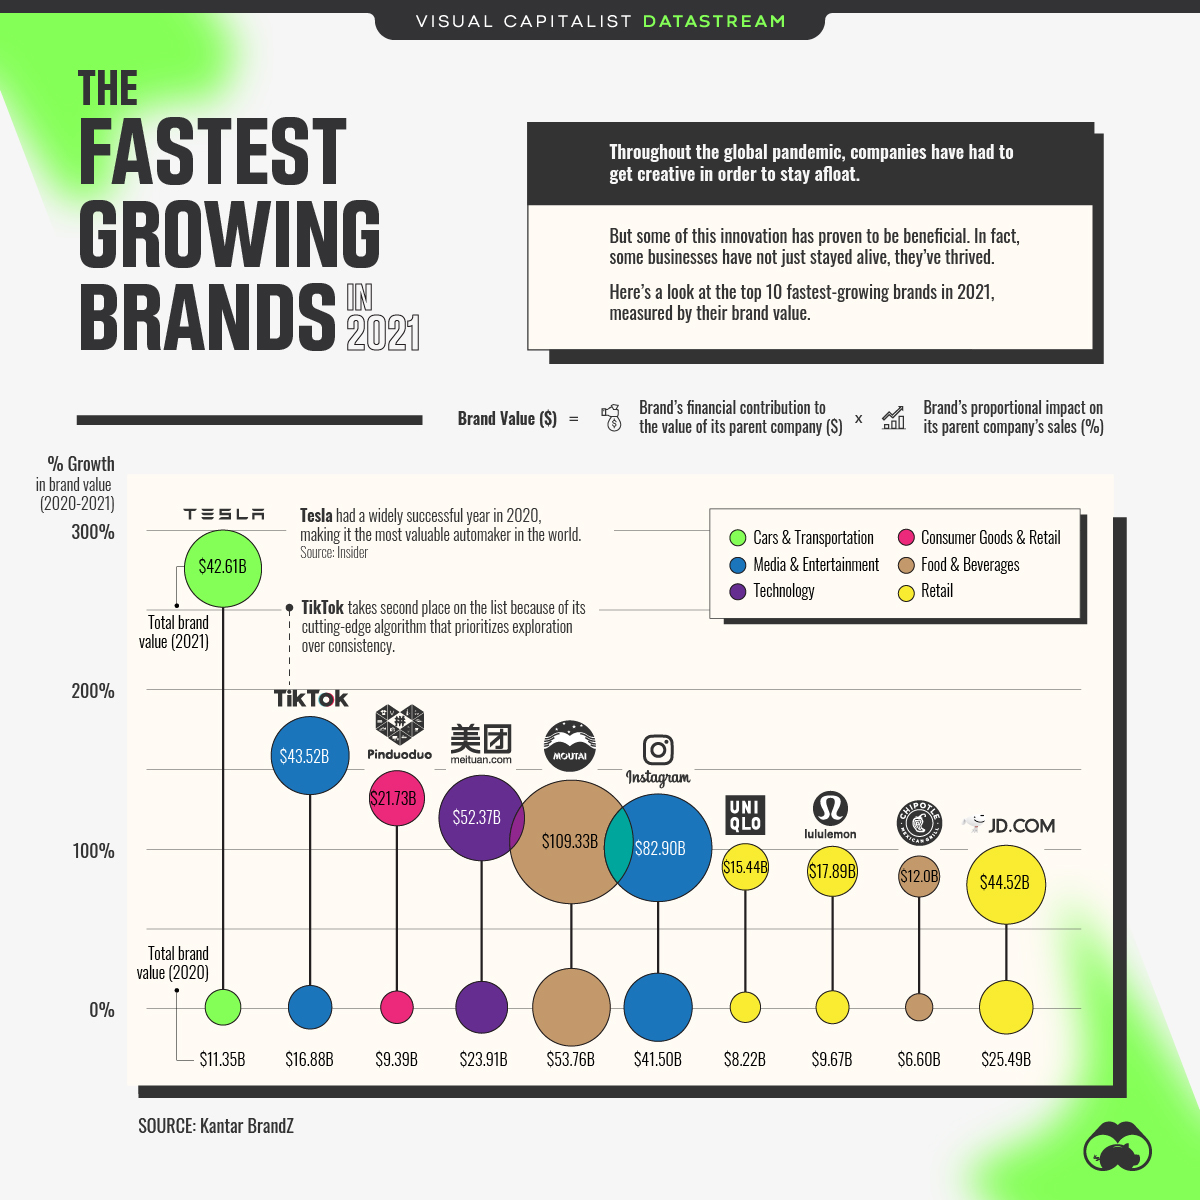


The Briefing
- The fastest growing brand on the list is Tesla, which isn’t surprising—the company’s stock increased by almost 700% in 2020.
- What happened for Tesla last year to warrant such a boost? The company entered the SUV market with its launch of the Model Y, and started production in China, which increased sales in the country by 90% in the first 9 months of 2020.
- TikTok, which ranks 2nd on the list, was the world’s most downloaded app in 2020.
The World’s Fastest Growing Brands in 2021
2020 was a tough year for the U.S. economy.
In Q2 2020, the country reported its steepest drop in real GDP ever recorded. Because of COVID-19, companies were forced to adapt. But things weren’t all bad—in fact, some companies even managed to prosper throughout the pandemic-induced madness.
Here’s a look at the top 10 fastest growing brands of 2021, using data from Kantar BrandZ’s Top 100 Global brands report:
| Rank | Brand | Brand Value % Growth | Category |
|---|---|---|---|
| 1 | Tesla | 275% | 🚗 Cars & Transportation |
| 2 | TikTok | 158% | 📱 Media & Entertainment |
| 3 | Pinduoduo | 131% | 🛍 Consumer Goods & Retail |
| 4 | Meituan | 119% | 💻 Technology |
| 5 | Moutai | 103% | 🍺 Food & Beverages |
| 6 | 100% | 📱 Media & Entertainment | |
| 7 | Uniqlo | 88% | 🛍 Retail |
| 8 | Lululemon | 85% | 🛍 Retail |
| 9 | Chipotle | 82% | 🌯 Food & Beverages |
| 10 | JD.com | 75% | 🛍 Retail |
Tesla takes the top spot, with an impressive 275% boost in brand value compared to the year prior. A big part of Tesla’s growth was its production expansion into China, which boosted sales in the country in early 2020.
It’s worth noting that Tesla sales in China have slumped recently—in July 2021, Tesla made up merely 3.9% of battery electric vehicles sales in China, down from 12.6% the month prior. The good news? Tesla’s investors don’t seem too concerned—following the news of decreased sales in China, Tesla’s stock prices dipped less than 1%.
Retail for the Win
When it comes to fastest growing brands in 2021, the most popular category is retail.
While many retailers took a hit in 2020, certain apparel brands with strong leisure offerings such as Lululmeon and Uniqlo experienced growth as consumer demand for comfortable, stay-at-home clothing boomed.
For instance, throughout store closures and city-wide lockdowns, Lululemon still managed to increase its net revenue by 11% in 2020. Of course, this growth was strongly supported by a surge in eCommerce sales.
>>Like this? Then check out this full-length article The Reputation of 100 Major Brands in the U.S.
Where does this data come from?
Source: Kantar BrandZ 2021 Top 100 Global Brands report.
Details: Fastest-growing brands are ranked by their “brand value,” which Kantar Brandz measures by multiplying a brand’s total financial value ($) with its proportional impact (%) on its parent company’s sales. For more information on methodology, check out the full report.


Datastream
Can You Calculate Your Daily Carbon Footprint?
Discover how the average person’s carbon footprint impacts the environment and learn how carbon credits can offset your carbon footprint.


The Briefing
- A person’s carbon footprint is substantial, with activities such as food consumption creating as much as 4,500 g of CO₂ emissions daily.
- By purchasing carbon credits from Carbon Streaming Corporation, you can offset your own emissions and fund positive climate action.
Your Everyday Carbon Footprint
While many large businesses and countries have committed to net-zero goals, it is essential to acknowledge that your everyday activities also contribute to global emissions.
In this graphic, sponsored by Carbon Streaming Corporation, we will explore how the choices we make and the products we use have a profound impact on our carbon footprint.
Carbon Emissions by Activity
Here are some of the daily activities and products of the average person and their carbon footprint, according to Clever Carbon.
| Household Activities & Products | CO2 Emissions (g) |
|---|---|
| 💡 Standard Light Bulb (100 watts, four hours) | 172 g |
| 📱 Mobile Phone Use (195 minutes per day)* | 189 g |
| 👕 Washing Machine (0.63 kWh) | 275 g |
| 🔥 Electric Oven (1.56 kWh) | 675 g |
| ♨️ Tumble Dryer (2.5 kWh) | 1,000 g |
| 🧻 Toilet Roll (2 ply) | 1,300 g |
| 🚿 Hot Shower (10 mins) | 2,000 g |
| 🚙 Daily Commute (one hour, by car) | 3,360 g |
| 🍽️ Average Daily Food Consumption (three meals of 600 calories) | 4,500 g |
| *Phone use based on yearly use of 69kg per the source, Reboxed | |
Your choice of transportation plays a crucial role in determining your carbon footprint. For instance, a 15 km daily commute to work on public transport generates an average of 1,464 g of CO₂ emissions. Compared to 3,360 g—twice the volume for a journey the same length by car.
By opting for more sustainable modes of transport, such as cycling, walking, or public transportation, you can significantly reduce your carbon footprint.
Addressing Your Carbon Footprint
One way to compensate for your emissions is by purchasing high-quality carbon credits.
Carbon credits are used to help fund projects that avoid, reduce or remove CO₂ emissions. This includes nature-based solutions such as reforestation and improved forest management, or technology-based solutions such as the production of biochar and carbon capture and storage (CCS).
While carbon credits offer a potential solution for individuals to help reduce global emissions, public awareness remains a significant challenge. A BCG-Patch survey revealed that only 34% of U.S. consumers are familiar with carbon credits, and only 3% have purchased them in the past.
About Carbon Streaming
By financing the creation or expansion of carbon projects, Carbon Streaming Corporation secures the rights to future carbon credits generated by these sustainable projects. You can then purchase these carbon credits to help fund climate solutions around the world and compensate for your own emissions.
Ready to get involved?
>> Learn more about purchasing carbon credits at Carbon Streaming

-

 Brands6 days ago
How Tech Logos Have Evolved Over Time
-

 Demographics2 weeks ago
The Smallest Gender Wage Gaps in OECD Countries
-

 Economy2 weeks ago
Where U.S. Inflation Hit the Hardest in March 2024
-

 Green2 weeks ago
Top Countries By Forest Growth Since 2001
-

 United States2 weeks ago
Ranked: The Largest U.S. Corporations by Number of Employees
-

 Maps2 weeks ago
The Largest Earthquakes in the New York Area (1970-2024)
-

 Green2 weeks ago
Ranked: The Countries With the Most Air Pollution in 2023
-

 Green2 weeks ago
Ranking the Top 15 Countries by Carbon Tax Revenue