Datastream
How Many Hours Do Americans Lose to Traffic Congestion?


The Briefing
- America’s major cities are some of the most congested in the world
- In 2020, the average driver in New York City lost 100 hours due to traffic
How Many Hours Do Americans Lose to Traffic Congestion?
No one likes being stuck in traffic. But have you ever wondered how many hours it’s actually taking away from you?
In some of the biggest U.S. cities, the answer could be over 100 hours in a single year.
2020 was very unique, however, and traffic was less severe due to the COVID-19 pandemic. For example, the average American driver lost 99 hours in 2019, compared to just 26 hours in 2020.
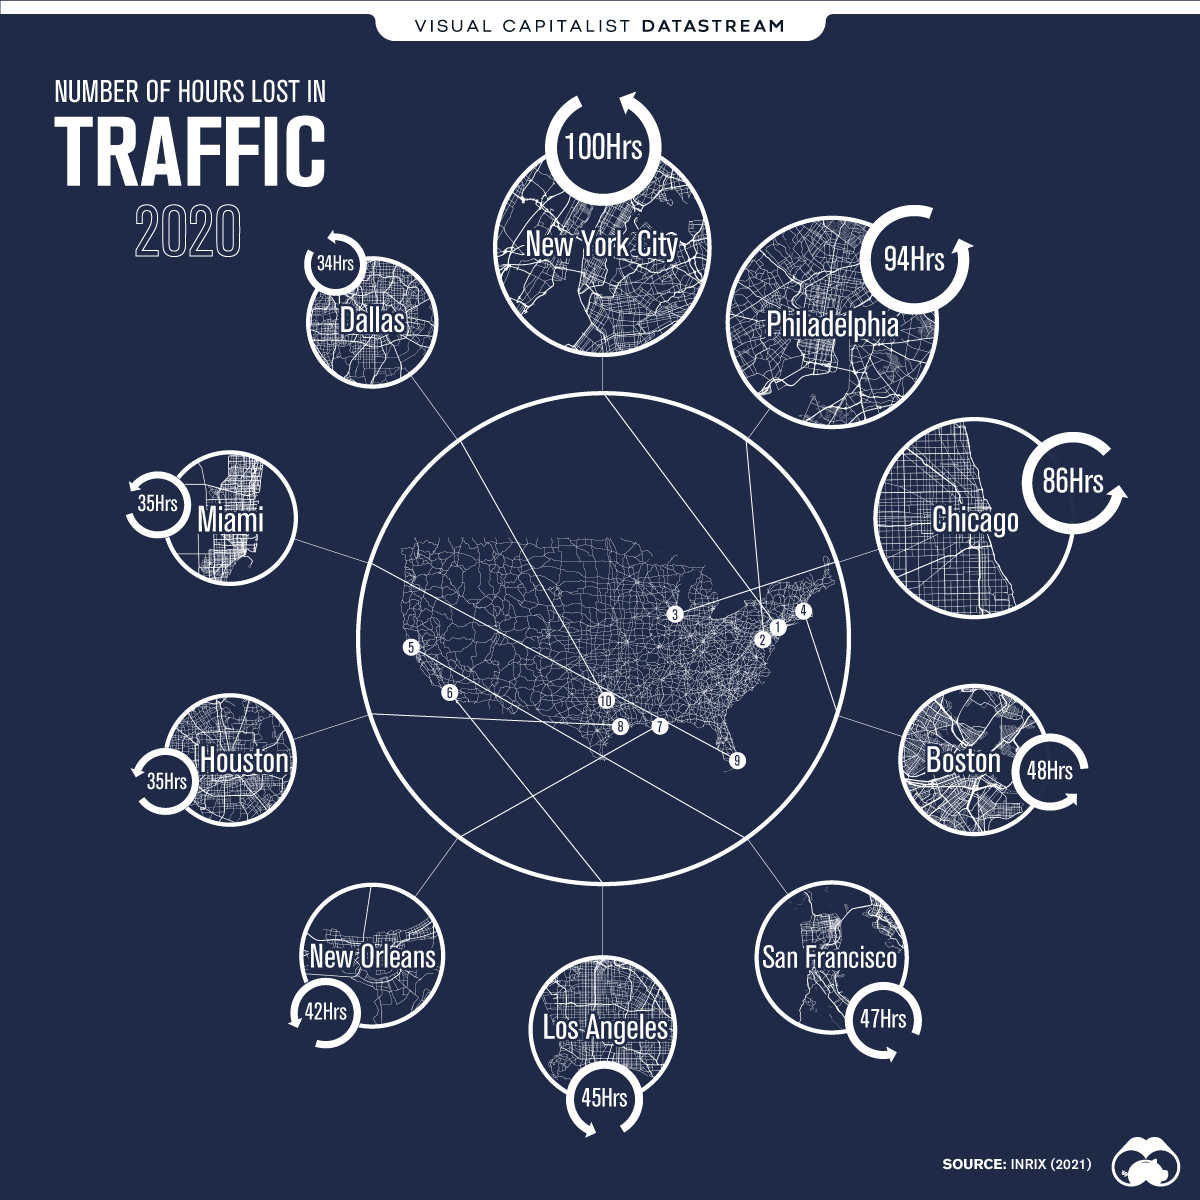
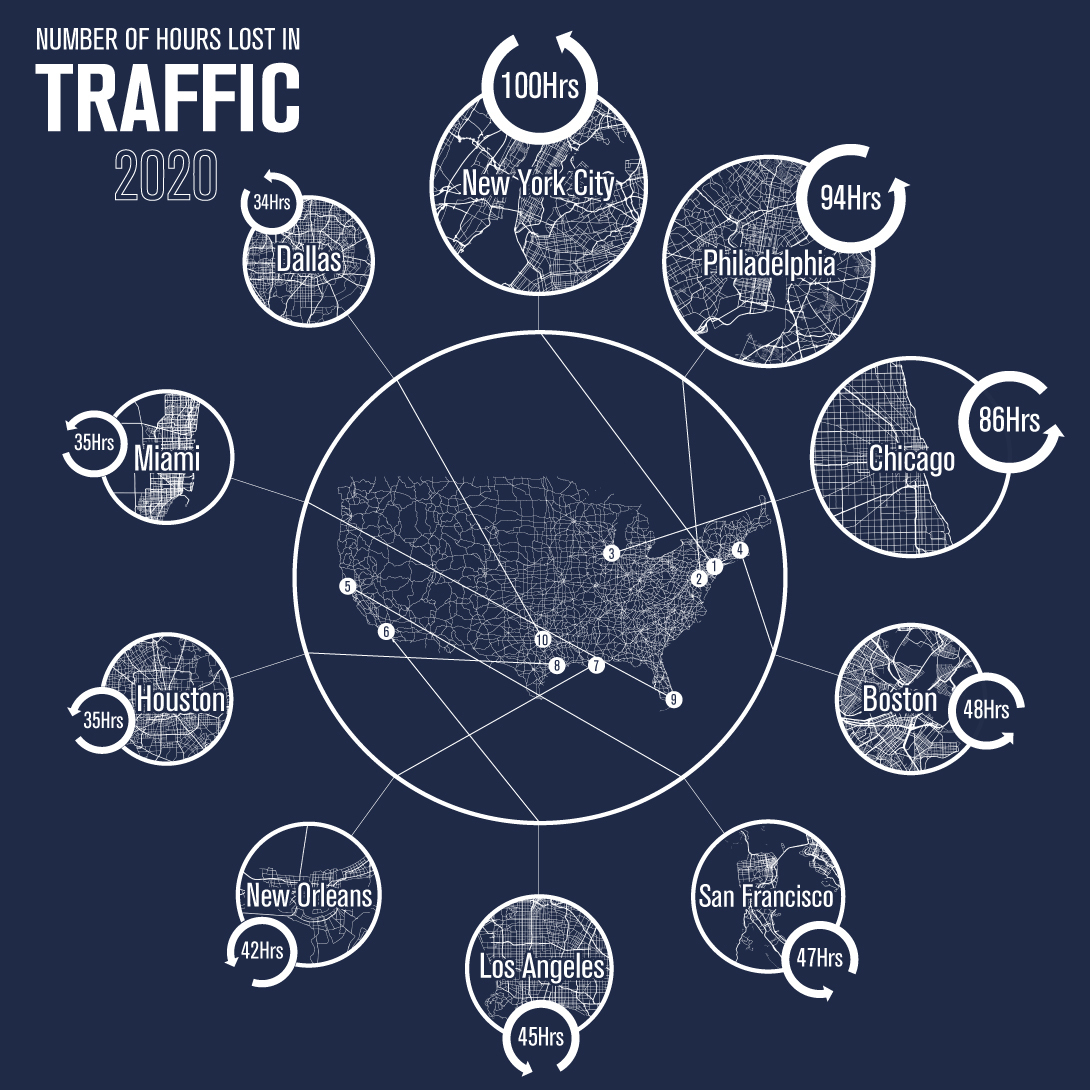
Nevertheless, drivers in America still lost a sizeable chunk of time throughout the year. To see exactly how much, we compiled data from INRIX to pinpoint the 10 most congested cities in America.
| City | Hours Lost in Congestion (2020) |
|---|---|
| New York City, NY | 100 |
| Philadelphia, PA | 94 |
| Chicago, IL | 86 |
| Boston, MA | 48 |
| Los Angeles, CA | 45 |
| San Francisco, CA | 47 |
| New Orleans, LA | 42 |
| Houston, TX | 35 |
| Miami, FL | 35 |
| Dallas, TX | 34 |
Unsurprisingly, America’s most populous city was also its most congested. As of 2020, New York City had a population of nearly 9 million people.
Going to a more granular level helps us identify New York City’s worst corridor: the Brooklyn Queens Expressway. Daily traffic on the segment between I-495 and Tillary Street is estimated to have cost drivers approximately 30 hours in 2020.
What Could You Have Done Instead?
Here’s a list of things that the average New Yorker could have done with the 100 hours they lost to traffic.
| Activity | Number of Hours Required |
|---|---|
| Take 2.5 weeks off work | 100 |
| Walk through Central Park 100 times | 100 |
| Read Leo Tolstoy’s most famous novels, War and Peace (1869) and Anna Karenina (1878) | 98 |
| Drive to Los Angeles and back (theoretical time which assumes no breaks are taken) | 84 |
| Watch the entire Game of Thrones TV series from beginning to end | 70 |
| Earn your private pilot license (actual flight training time) | 40 |
Source: Audible, FAA, Google Maps, Statista
Traffic is going to get worse as more people move to urban areas, but this doesn’t mean that all hope is lost.
The majority of traffic problems are caused by human behavior, meaning autonomous vehicles could reduce many of the inefficiencies that cause congestion. Unfortunately, Level 5 self-driving cars are still a ways off, despite the claims of Tesla CEO Elon Musk.
Source: INRIX
Notes: “Hours lost” refers to the number of hours lost in congestion during peak commute periods compared to free flow conditions.


Datastream
Can You Calculate Your Daily Carbon Footprint?
Discover how the average person’s carbon footprint impacts the environment and learn how carbon credits can offset your carbon footprint.


The Briefing
- A person’s carbon footprint is substantial, with activities such as food consumption creating as much as 4,500 g of CO₂ emissions daily.
- By purchasing carbon credits from Carbon Streaming Corporation, you can offset your own emissions and fund positive climate action.
Your Everyday Carbon Footprint
While many large businesses and countries have committed to net-zero goals, it is essential to acknowledge that your everyday activities also contribute to global emissions.
In this graphic, sponsored by Carbon Streaming Corporation, we will explore how the choices we make and the products we use have a profound impact on our carbon footprint.
Carbon Emissions by Activity
Here are some of the daily activities and products of the average person and their carbon footprint, according to Clever Carbon.
| Household Activities & Products | CO2 Emissions (g) |
|---|---|
| 💡 Standard Light Bulb (100 watts, four hours) | 172 g |
| 📱 Mobile Phone Use (195 minutes per day)* | 189 g |
| 👕 Washing Machine (0.63 kWh) | 275 g |
| 🔥 Electric Oven (1.56 kWh) | 675 g |
| ♨️ Tumble Dryer (2.5 kWh) | 1,000 g |
| 🧻 Toilet Roll (2 ply) | 1,300 g |
| 🚿 Hot Shower (10 mins) | 2,000 g |
| 🚙 Daily Commute (one hour, by car) | 3,360 g |
| 🍽️ Average Daily Food Consumption (three meals of 600 calories) | 4,500 g |
| *Phone use based on yearly use of 69kg per the source, Reboxed | |
Your choice of transportation plays a crucial role in determining your carbon footprint. For instance, a 15 km daily commute to work on public transport generates an average of 1,464 g of CO₂ emissions. Compared to 3,360 g—twice the volume for a journey the same length by car.
By opting for more sustainable modes of transport, such as cycling, walking, or public transportation, you can significantly reduce your carbon footprint.
Addressing Your Carbon Footprint
One way to compensate for your emissions is by purchasing high-quality carbon credits.
Carbon credits are used to help fund projects that avoid, reduce or remove CO₂ emissions. This includes nature-based solutions such as reforestation and improved forest management, or technology-based solutions such as the production of biochar and carbon capture and storage (CCS).
While carbon credits offer a potential solution for individuals to help reduce global emissions, public awareness remains a significant challenge. A BCG-Patch survey revealed that only 34% of U.S. consumers are familiar with carbon credits, and only 3% have purchased them in the past.
About Carbon Streaming
By financing the creation or expansion of carbon projects, Carbon Streaming Corporation secures the rights to future carbon credits generated by these sustainable projects. You can then purchase these carbon credits to help fund climate solutions around the world and compensate for your own emissions.
Ready to get involved?
>> Learn more about purchasing carbon credits at Carbon Streaming

-

 Mining1 week ago
Gold vs. S&P 500: Which Has Grown More Over Five Years?
-

 Markets2 weeks ago
Ranked: The Most Valuable Housing Markets in America
-

 Money2 weeks ago
Which States Have the Highest Minimum Wage in America?
-

 AI2 weeks ago
Ranked: Semiconductor Companies by Industry Revenue Share
-

 Markets2 weeks ago
Ranked: The World’s Top Flight Routes, by Revenue
-

 Demographics2 weeks ago
Population Projections: The World’s 6 Largest Countries in 2075
-

 Markets2 weeks ago
The Top 10 States by Real GDP Growth in 2023
-

 Demographics2 weeks ago
The Smallest Gender Wage Gaps in OECD Countries