VC+
What’s New on VC+ in October?
Visual Capitalist is home to data-driven, visual storytelling that helps explain a complex world.
But did you know there’s even more visuals and insight you can get access to, all while helping support what we do?
More Visuals. More Insight. More Understanding.

VC+ is our premium subscription with exclusive access to special features, all sent directly to your email. So, what is getting sent to members in the coming weeks?
“Visualizing a Rapidly Aging World”
SPECIAL DISPATCH: A Roundup of 6 Fascinating Visuals on Aging Population
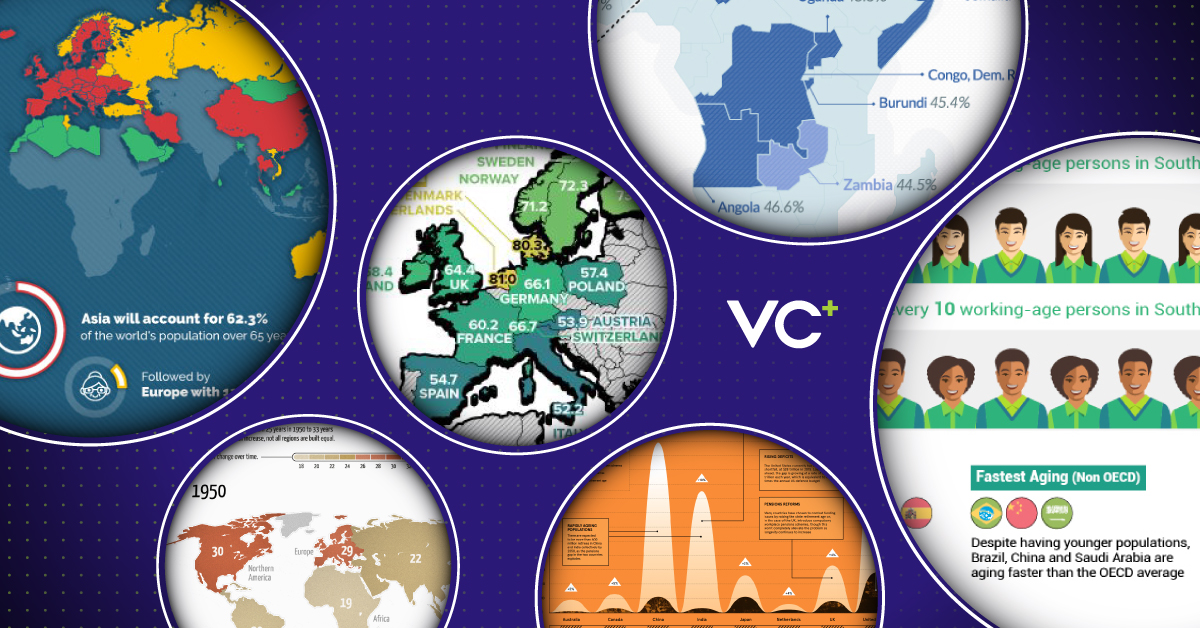
Despite the youth ruling our digital world, the average age of populations is increasingly getting older and older.
In this VC+ Special Dispatch, we turn back the hands of time to uncover some of our favorite pieces that explain the key trends and implications of a changing demographic.
Publishing date: October 6 (Get VC+ to access)
“VC 360: A Critical Analysis on the Environment”
SPECIAL DISPATCH: Examining Attempts to Visualize Climate Change
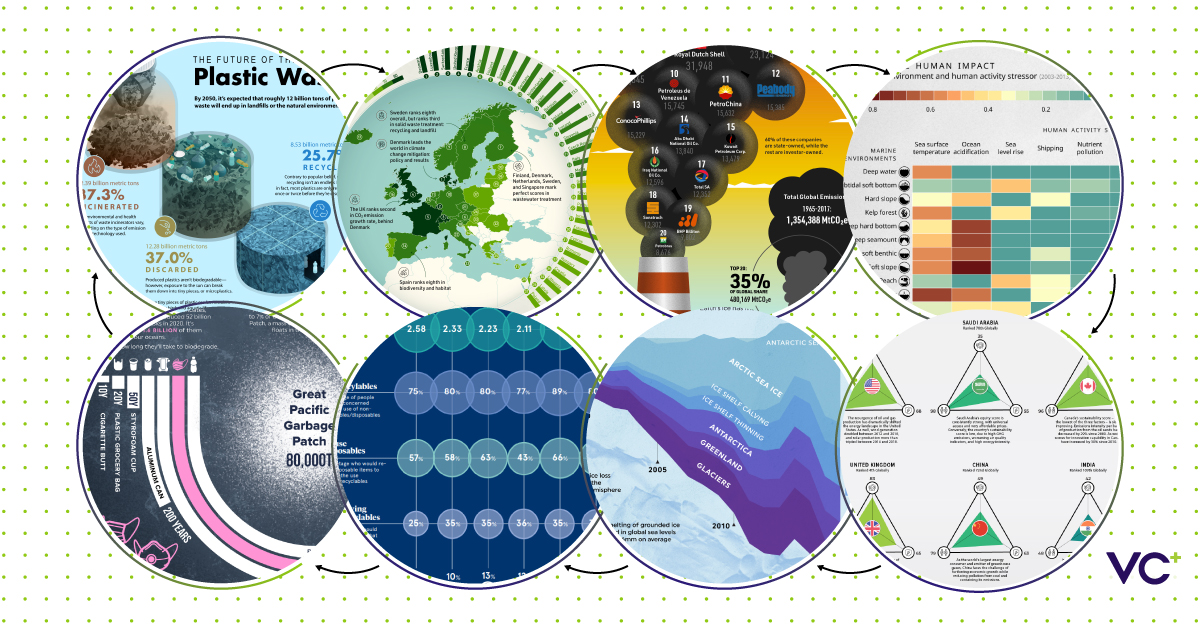
The 26th UN Climate Change Conference of the Parties (COP26) will commence October 31st, bringing forth discussions about the environment and how it’s shaping our future.
This VC+ Special Dispatch looks at how various organizations and media outlets have covered the impacts of global warming. From the Anthropocene to climate targets, we’ll dissect some of the most popular visualizations and assess how successful they were at communicating their point.
Publishing date: October 13 (Get VC+ to access)
“The Lookout: Creators to Watch”
SPECIAL DISPATCH: Our Top Picks to Follow in 2021
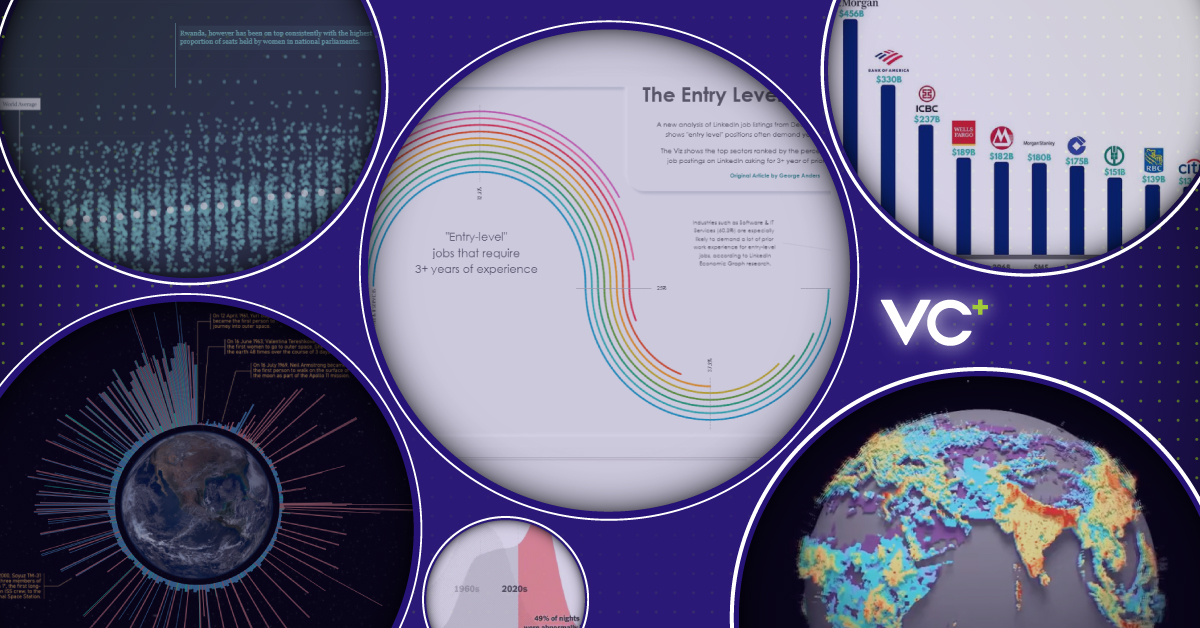
At Visual Capitalist, we know a thing or two about creating data-driven visuals. However, it’s time we shine a light on the incredible work done by others in our growing field.
In this VC+ Special Dispatch, we pull together a list of five impressive creators to follow along with colorful commentary on what makes them stand out in the crowd.
Publishing date: October 20 (Get VC+ to access)
“The News in Charts: October 2021”
SPECIAL DISPATCH: Powerful Charts From News Stories of the Past Month
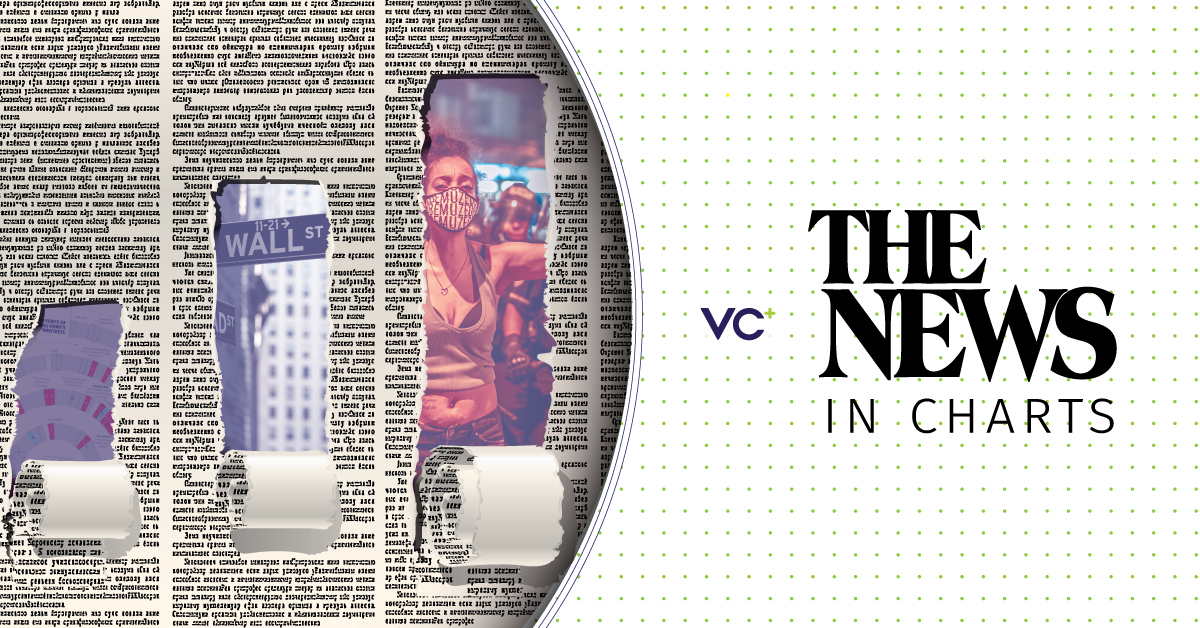
With the fast-paced news cycle, it can be quite difficult to keep track of all that’s going on.
In this recurring feature, we look back at some of the most newsworthy events of October 2021 across the economy, politics, and society—and provide key takeaways using succinct charts from various media outlets.
Publishing date: October 27 (Get VC+ to access)
The Trendline
PREMIUM NEWSLETTER: Our Weekly Newsletter for VC+ Members

Every week, VC+ members also get our premium graphic newsletter, The Trendline.
With The Trendline, we send you the best visual content, datasets, and insightful reports relating to business that our editors find each week.
Publishing Date: Every Sunday (Get VC+ to access)
Limited Time Offer
Get access to these upcoming features by becoming a VC+ member.
For a limited time get 25% off, making your subscription the same price as a coffee each month:
P.S. – We look forward to sending you even more great visuals and data!


VC+
What’s New on VC+ in March?
This month’s VC+ special dispatches feature the insights from Knight Frank’s latest flagship report and markets this month.

If you’re a regular visitor to Visual Capitalist, you know that we’re your home base for data-driven, visual storytelling that helps explain a complex world.
But did you know there’s a way to get even more out of Visual Capitalist, all while helping support the work we do?
VC+ is our members program that gives you exclusive access to the weekly visual insights that leaders at Fortune 500 companies use to stay ahead.
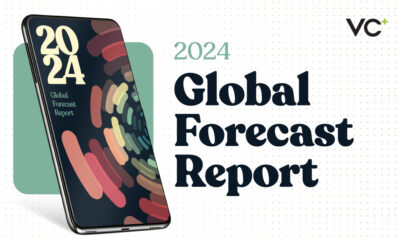
Along with The Trendline newsletter twice a week and our monthly special dispatches, you’ll also get access to our new VC+ Archive—unlocking hundreds of insights in one place including our latest Global Forecast Series.
Here’s what VC+ members can look forward to for the rest of this month:
New to VC+ in March 2024
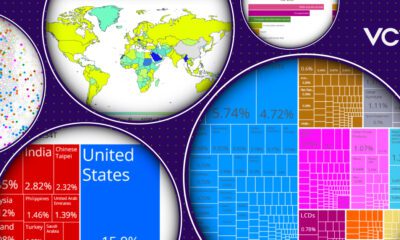
“At a Glance: Key Takeaways from Knight Frank’s 2024 Wealth Report”
SPECIAL DISPATCH: Breaking Down the Insights from Knight Frank’s Latest Flagship Report

In today’s world, time is of the essence. With the sea of information that exists, it’s difficult to extract what’s truly important.
In this Special Dispatch series, we do the work for you, analyzing global reports from reputable sources to neatly deliver the key takeaways along with context and commentary.
This time, we’ll examine Knight Frank’s 2024 Wealth Report, the organization’s flagship publication which breaks down changes in global wealth distribution, property markets, and the trends that matter most for ultra-high-net-worth individuals.
Coming Tuesday, March 12th, 2024 (Get VC+ to access)
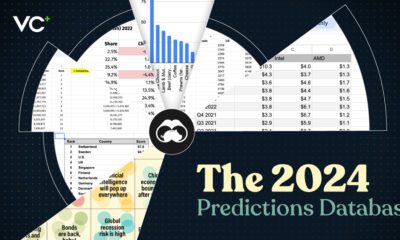
“Markets This Month: March Edition”
SPECIAL DISPATCH: Everything You Need to Know for This Month in the Markets
This Special Dispatch exclusive to VC+ subscribers provides a high-level summary of key events and the most important market trends coming up. It’s our way of cutting through the noise and sending you the data that matters most for the markets each month.
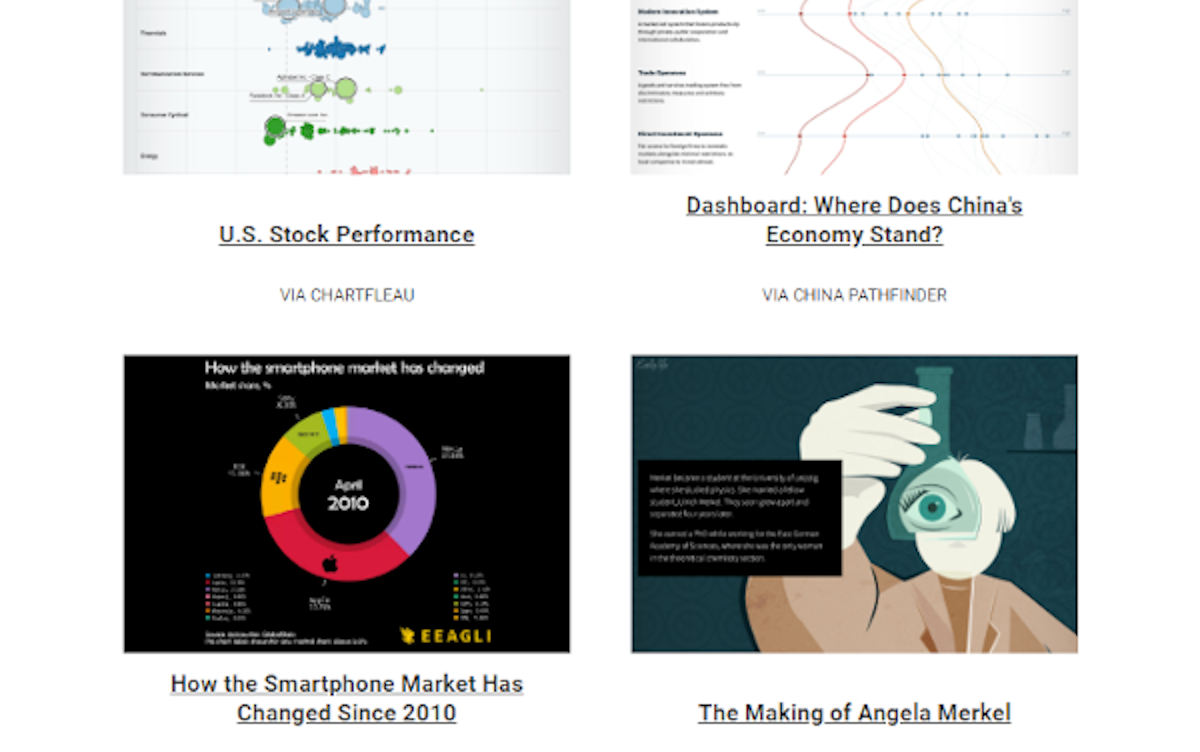
March’s edition will include:
- An economic calendar of the biggest data and earnings releases to be aware of
- A handful of essential charts diving into the state of the markets
- And a collection of insightful links worth reading, watching, and listening to
Coming Tuesday, March 26th, 2024 (Get VC+ to access)
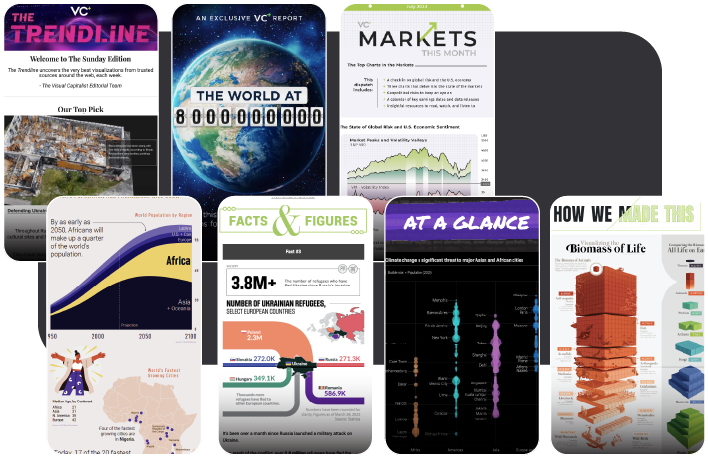
The Trendline
PREMIUM NEWSLETTER: Our Bi-Weekly Newsletter for VC+ Members
The Sunday Edition The Midweek Edition
The Best Visualizations Each Week The Best Data and Reports Each Week

>> View free sample >> View free sample
The Trendline is our premium newsletter sent to members twice a week.
On Sundays, we highlight the best visualizations on business, investing, and global trends that our editors have uncovered. On Thursdays in the Midweek Edition, we send you a round-up of the most interesting reports we find along with key charts and commentary.
The Trends Shaping the World—in Your Inbox
Get access to these upcoming features by becoming a VC+ member. And for a limited time, get 25% off, which makes your VC+ membership the same price as a coffee each month:
PS – We look forward to sending you even more great visuals and data!

-

 Mining2 weeks ago
Charted: The Value Gap Between the Gold Price and Gold Miners
-

 Real Estate1 week ago
Ranked: The Most Valuable Housing Markets in America
-

 Business1 week ago
Charted: Big Four Market Share by S&P 500 Audits
-

 AI1 week ago
The Stock Performance of U.S. Chipmakers So Far in 2024
-

 Misc1 week ago
Almost Every EV Stock is Down After Q1 2024
-

 Money2 weeks ago
Where Does One U.S. Tax Dollar Go?
-

 Green2 weeks ago
Ranked: Top Countries by Total Forest Loss Since 2001
-

 Real Estate2 weeks ago
Visualizing America’s Shortage of Affordable Homes