Personal Finance
How Does Your Personality Type Affect Your Income?
How Does Your Personality Type Affect Your Income?
You’ve just finished giving a presentation at work, and an outspoken coworker challenges your ideas. Do you:
a) Engage in a friendly debate about the merits of each argument, or
b) Avoid a conflict by agreeing or changing the subject?
The way you approach this type of situation may influence how much money you earn.
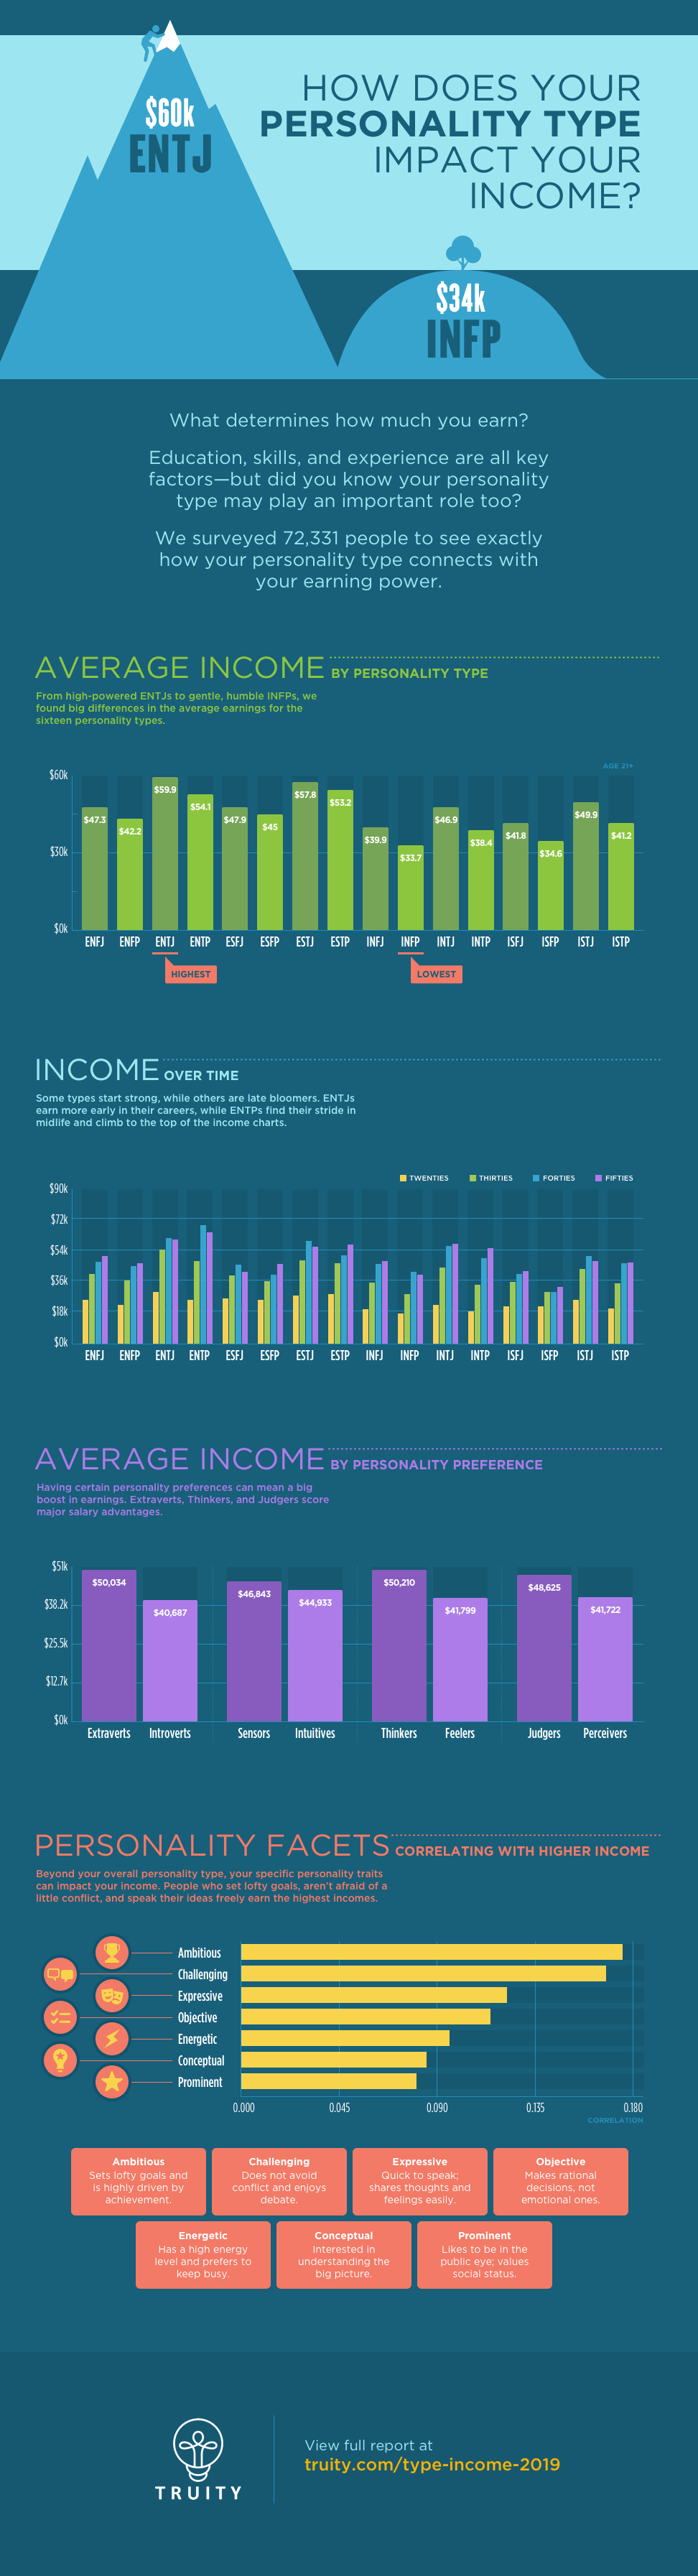
Today’s infographic comes to us from Truity, and it outlines the potential relationship between personality type and income.
Through the Myers-Briggs Lens
The Myers-Briggs personality test serves as a robust framework for analyzing the connection between personality and income, in a way that is easily understood and familiar to many people.
The theory outlines four personality dimensions that are described using opposing traits.
- Extraversion vs. Introversion: Extroverts gain energy by interacting with others, while introverts draw energy from spending time alone.
- Sensing vs. Intuition: Sensors prefer concrete and factual information, while intuitive types use their imagination or wider patterns to interpret information.
- Thinking vs. Feeling: Thinkers make rational decisions based on logic, while feelers make empathetic decisions considering the needs of others.
- Judging vs. Perceiving: Judging types organize their life in a structured manner, while perceiving types are more flexible and spontaneous.
For example, someone who aligns with extraversion, sensing, thinking, and judging would be described as an ESTJ type.
The researchers surveyed over 72,000 people to measure these four personality preferences, as well as 23 unique facets of personality, income levels, and career-related data.
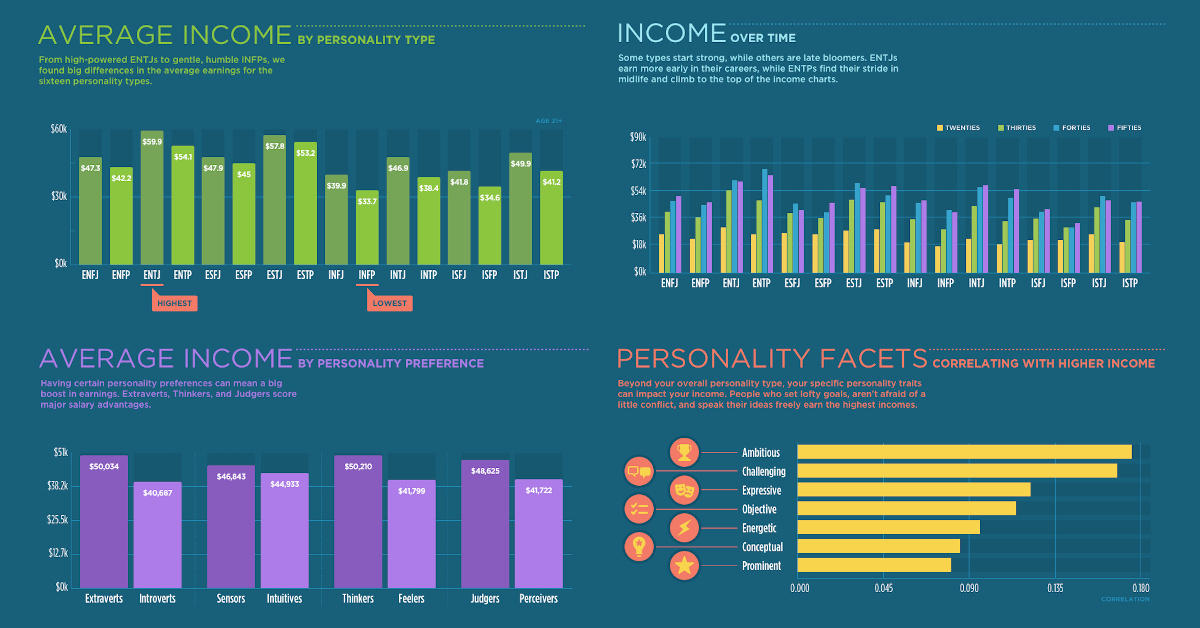
Traits With the Highest Earning Potential
Based on the above four dimensions, extroverts, sensors, thinkers, and judgers tend to be the most financially successful. Diving into specific personality characteristics, certain traits are more closely correlated with higher income.
| Personality Type | Average Income Advantage (Annual) | Trait(s) Most Correlated With Income Advantage |
|---|---|---|
| Extroverts | $9,347 | Expressive, Energetic, Prominent |
| Sensors | $1,910 | Conceptual |
| Thinkers | $8,411 | Challenging, Objective, Rational |
| Judgers | $6,903 | Ambitious |
For instance, extroverts are much more likely to have higher incomes if they are quick to share thoughts, have high energy, and like being in the public eye. Thinkers also score high on income potential, especially if they enjoy debates, make rational decisions, and moderate their emotions.
The Top Earners
Which personality types earn the highest incomes of all? Extroverted thinking types dominate the ranks again.
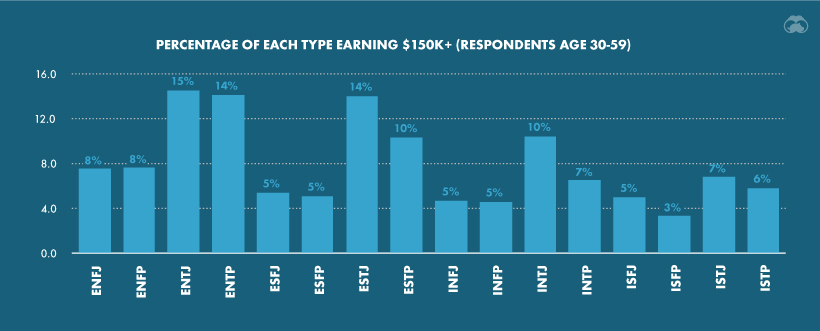
Source: Truity
The one exception is INTJs, with 10% earning an annual salary of $150K or more in their peak earning years.
Personality and the Gender Pay Gap
With all these factors in mind, the researchers analyzed whether personality differences would affect the gender pay gap.
When the average salaries were separated for men and women, the results were clear: men of almost all personality types earn more than the average income for the sample overall, while all but two personality types of women earned less than the average.
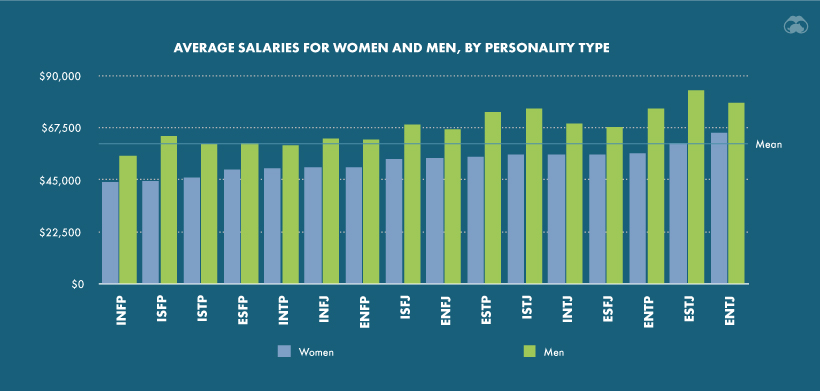
Source: Truity
In fact, women with high-earning personality types still earn less than men who do not possess those traits. For example, extroverted women earn about $55,000 annually, while introverted men earn an average of over $64,000.
Maximizing Your Potential
Are the introverted personalities of the world doomed to lower salaries? Not necessarily—while personality does play a role, many other factors contribute to income levels:
- Level of education
- Years of experience
- Local job market
- Type of industry
- The particular career
Not only that, anyone can work on the two specific personality traits most aligned with higher incomes: set ambitious goals, and face conflict head-on to ensure your voice is heard.


Personal Finance
Chart: The Declining Value of the U.S. Federal Minimum Wage
This graphic compares the nominal vs. inflation-adjusted value of the U.S. minimum wage, from 1940 to 2023.


The Declining Value of the U.S. Federal Minimum Wage
This was originally posted on our Voronoi app. Download the app for free on iOS or Android and discover incredible data-driven charts from a variety of trusted sources.
This graphic illustrates the history of the U.S. federal minimum wage using data compiled by Statista, in both nominal and real (inflation-adjusted) terms. The federal minimum wage was raised to $7.25 per hour in July 2009, where it has remained ever since.
Nominal vs. Real Value
The data we used to create this graphic can be found in the table below.
| Year | Nominal value ($/hour) | Real value ($/hour) |
|---|---|---|
| 1940 | 0.3 | 6.5 |
| 1945 | 0.4 | 6.82 |
| 1950 | 0.75 | 9.64 |
| 1955 | 0.75 | 8.52 |
| 1960 | 1 | 10.28 |
| 1965 | 1.25 | 12.08 |
| 1970 | 1.6 | 12.61 |
| 1975 | 2.1 | 12.04 |
| 1980 | 3.1 | 11.61 |
| 1985 | 3.35 | 9.51 |
| 1990 | 3.8 | 8.94 |
| 1995 | 4.25 | 8.49 |
| 2000 | 5.15 | 9.12 |
| 2005 | 5.15 | 8.03 |
| 2010 | 7.25 | 10.09 |
| 2015 | 7.25 | 9.3 |
| 2018 | 7.25 | 8.78 |
| 2019 | 7.25 | 8.61 |
| 2020 | 7.25 | 8.58 |
| 2021 | 7.25 | 8.24 |
| 2022 | 7.25 | 7.61 |
| 2023 | 7.25 | 7.25 |
What our graphic shows is how inflation has eroded the real value of the U.S. minimum wage over time, despite nominal increases.
For instance, consider the year 1960, when the federal minimum wage was $1 per hour. After accounting for inflation, this would be worth around $10.28 today!
The two lines converge at 2023 because the nominal and real value are identical in present day terms.
Many States Have Their Own Minimum Wage
According to the National Conference of State Legislatures (NCSL), 30 states and Washington, D.C. have implemented a minimum wage that is higher than $7.25.
The following states have adopted the federal minimum: Georgia, Idaho, Indiana, Iowa, Kansas, Kentucky, New Hampshire, North Carolina, North Dakota, Oklahoma, Pennsylvania, Texas, Utah, Wisconsin, and Wyoming.
Meanwhile, the states of Alabama, Louisiana, Mississippi, South Carolina, and Tennessee have no wage minimums, but have to follow the federal minimum.
How Does the U.S. Minimum Wage Rank Globally?
If you found this topic interesting, check out Mapped: Minimum Wage Around the World to see which countries have the highest minimum wage in monthly terms, as of January 2023.

-

 Mining1 week ago
Gold vs. S&P 500: Which Has Grown More Over Five Years?
-

 Markets2 weeks ago
Ranked: The Most Valuable Housing Markets in America
-

 Money2 weeks ago
Which States Have the Highest Minimum Wage in America?
-

 AI2 weeks ago
Ranked: Semiconductor Companies by Industry Revenue Share
-

 Markets2 weeks ago
Ranked: The World’s Top Flight Routes, by Revenue
-

 Countries2 weeks ago
Population Projections: The World’s 6 Largest Countries in 2075
-

 Markets2 weeks ago
The Top 10 States by Real GDP Growth in 2023
-

 Demographics2 weeks ago
The Smallest Gender Wage Gaps in OECD Countries