
In this infographic, we map out internet usage by global region based on the latest data from the World Bank.


click for more →


Scan with your phone's camera or QR code app to view
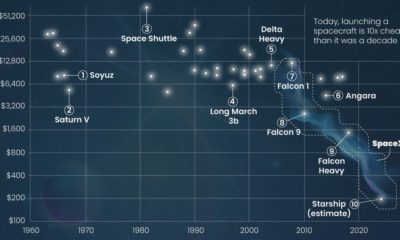

How much does a space flight cost? Here’s a look at the cost per kilogram for space launches across the globe since 1960.
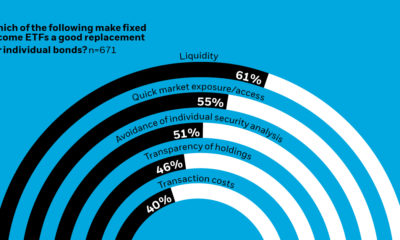

Fixed income ETFs are a go-to tool for institutional investors. Find out why professionals use them in this graphic.


Feeling disconnected? This infographic teaches you how to build strong leadership communities in your organization in a hybrid working world.
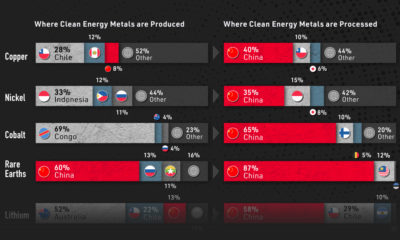

Despite being the world's biggest carbon emitter, China is also a key producer of most of the critical minerals for the green revolution.
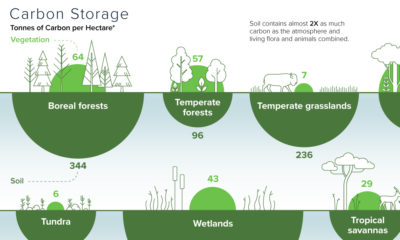

Forests are vital carbon sinks, soaking up about 40% of all emissions annually. Here is the carbon storage of ecosystems around the world.
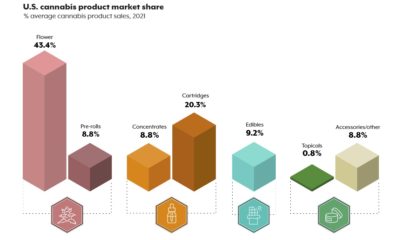

The cannabis industry is growing by billions every year. This graphic provides an overview of cannabis products and ranks their popularity.
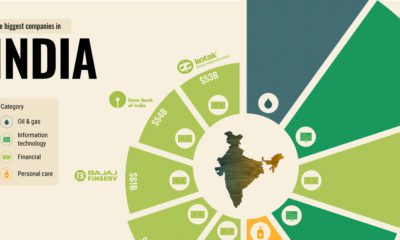

What are the biggest companies in India, one of the largest and most populated countries in the world?
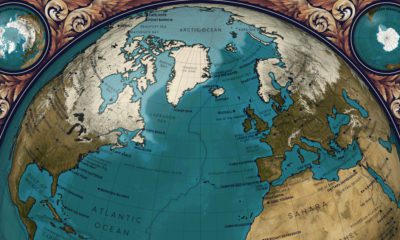

This map visualizes Earth’s seasons, showing how our planet’s Arctic sea ice and vegetation changes throughout the year.
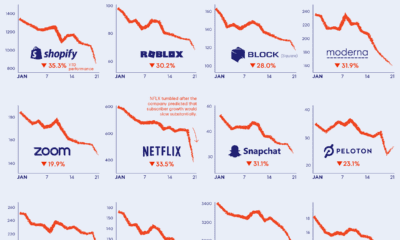

Worries over post-COVID demand and rising interest rates have fueled a market selloff, with pandemic stocks hit particularly hard.
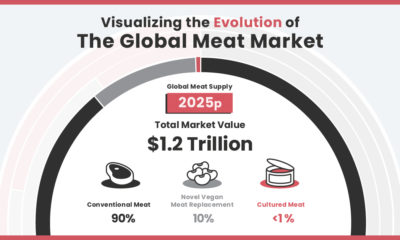

The global meat market will be worth $1.8 trillion by 2040, but how much of that will plant-based alternatives and cultured meat command?
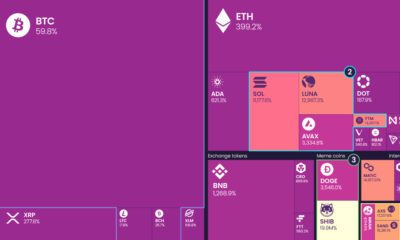

Cryptocurrencies had a breakout year in 2021, providing plenty of volatility and strong returns across crypto's various sectors.
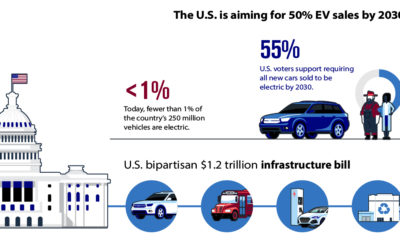

The U.S. is accelerating its transition to electric vehicles but obtaining the minerals and metals required for EVs remains a challenge. In this infographic, we explore...
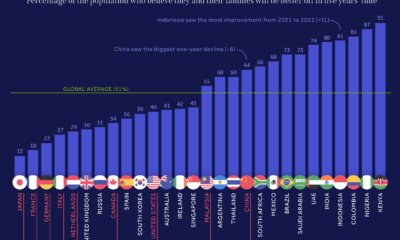

In many of the world's largest economies, including the U.S., Germany, and China, optimism around economic prospects sits at an all-time low.
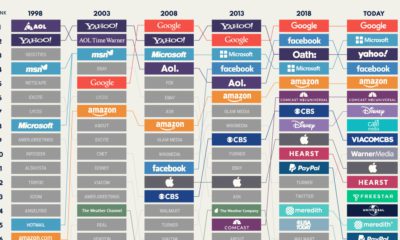

A lot has changed since Yahoo and AOL were the homepages of choice. This visualization looks at the largest internet giants in the U.S. since 1998.
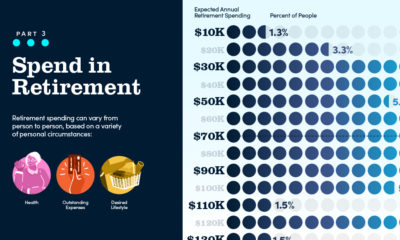

Retirement expenses can vary significantly from person to person. In this graphic, we show the range of expected retirement spending.
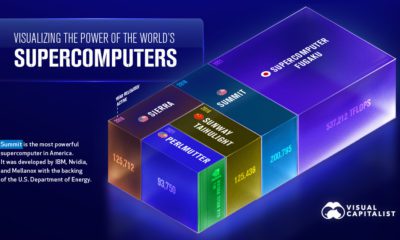

Supercomputers are some of the most advanced machines humans have ever created. See how they stack up in this infographic.
Nuclear power accounted for 10% of global electricity generated in 2020. Here's a look at the largest nuclear power producers.


 Creator Program