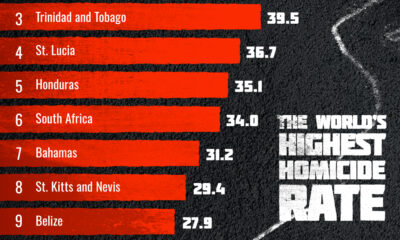
This graphic shows the top 10 most dangerous countries in the world, based on homicide rates per 100,000 people.


click for more →


Scan with your phone's camera or QR code app to view
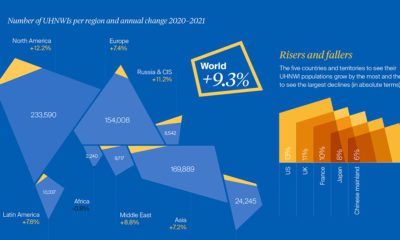

The global pool of ultra-high-net-worth individuals (UHNWI) has skyrocketed 75% in five years. In 2021 alone, it jumped 9.3%.
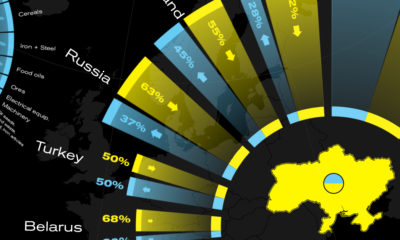

This graphic visualizes Ukraine's top international trading partners and the country's most exported and imported products in 2020.
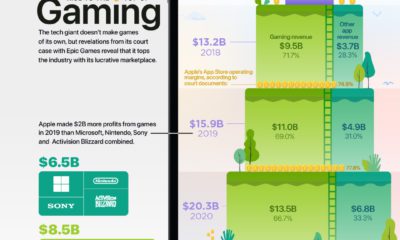

In 2020, Apple generated an estimated $13.5 billion dollars in gaming revenue, despite the fact it doesn't make any games or gaming consoles.


Amazon's shipping costs have surged to over $150 billion - a number that has almost doubled since the start of the pandemic.
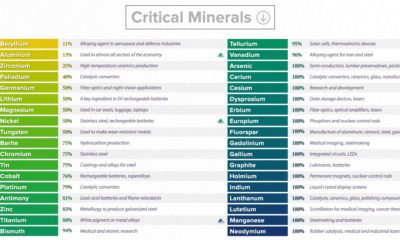

This graphic lists all minerals that are deemed critical to both the economic and national security of the United States.
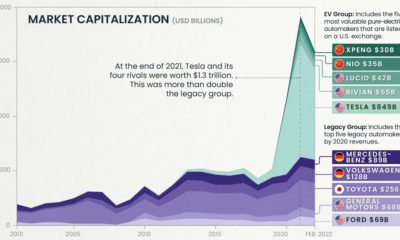

EV valuations have exploded since 2020, dwarfing those of legacy automakers like Ford and Toyota. Gain further insight with this infographic.
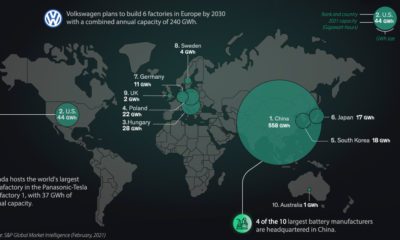

Which countries are leading the race for EV batteries?
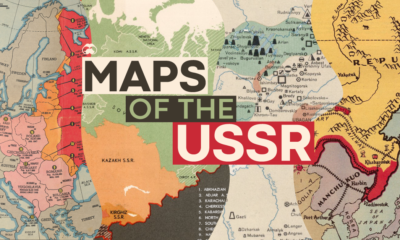

These historical maps tell the story of the USSR, and how its territorial expansion and contraction is linked to present day geopolitical events.
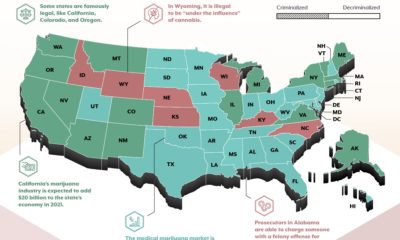

The legal status of the cannabis in the U.S. is often unclear. This map from Tenacious Labs lays out the legality of cannabis state by state.
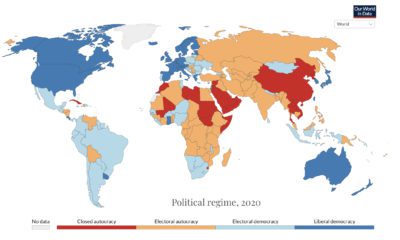

Only 93 countries enjoy a basic level of democratic rights as of 2020. Find out how this has changed in 200 years.
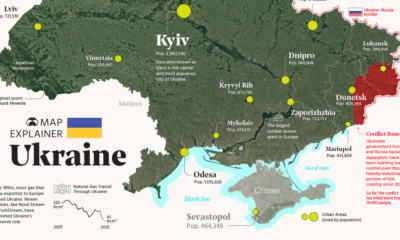

Ukraine has made the headlines due to the ongoing tensions with Russia. In this map infographic, we examine Ukraine from a structural point of view.
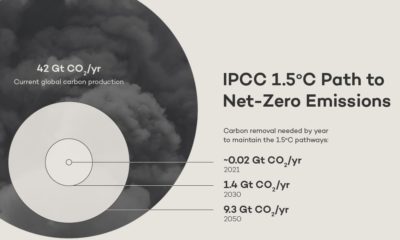

Carbon removal technologies are the best way to tackle rising global temperatures. Here we visualize how these technologies can help.
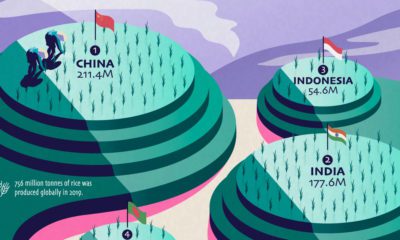

Over half of the world’s population lives on rice as a staple food, but just a few countries dominate global rice production.
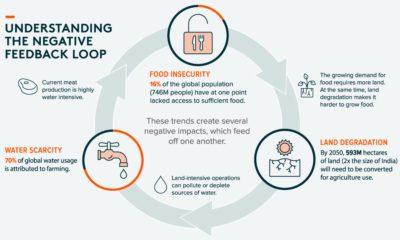

Agriculture technology (Agtech) and food innovation have the power to revolutionize the way we produce food.
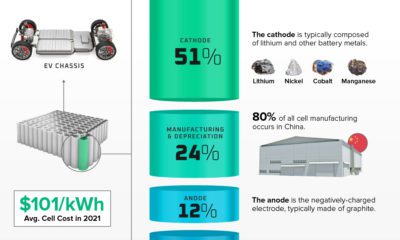

The average cost of EV batteries has fallen by 89% since 2010. What makes up the cost of a single EV battery cell?
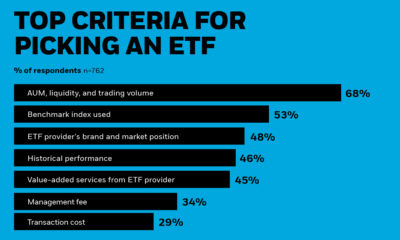

Institutional investors are increasing their use of ETFs. Learn about their selection process in this infographic.
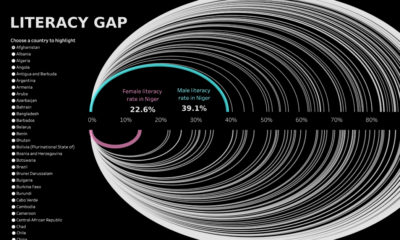

Global literacy rates have increased in the last few decades, but some countries are still lagging behind, especially in Sub-Saharan Africa.


 Creator Program