Misc
4 Historical Maps that Explain the USSR
The eyes of the world are now fixed on the Russian invasion of Ukraine.
The motivations of Russia’s president, Vladimir Putin, are now the biggest unanswered question of this geopolitical event. One prominent line of thinking is that Putin is looking to reclaim the territory lost after the dissolution of the Union of Soviet Socialist Republics (USSR), and the Russian leader’s own words appear to support this claim:
Ukraine is not just a neighboring country for us. It is an inalienable part of our own history, culture and spiritual space. Since time immemorial, the people living in the south-west of what has historically been Russian land have called themselves Russians.
The disintegration of our united country was brought about by the historic, strategic mistakes on the part of Bolshevik and Soviet leaders […] the collapse of the historical Russia known as the USSR is on their conscience.
For anyone born after the 1970s, memories of that era range from hazy to non-existent, so it’s worth answering the question: What was the USSR anyway?
Below, we’ll use historical maps from three specific eras to build context for how the USSR was structured, which modern countries were a part of this sprawling country, and how its history relates to Russia’s present day pushes for territorial expansion.
Let’s dive in.
The Early Days of the Soviet Union
The USSR was first born in 1922, in the aftermath of the fallen Russian Empire. A civil war between the Bolshevik Red Army and anti-Bolshevik forces across the region ended with the former coming out victorious. This resulted in the unification of a number of republics to form the Soviet Union.
After a number of tumultuous years during the reign of Joseph Stalin, which include a devastating famine which killed millions of people, we arrive at our first snapshot in time: the late 1930s.
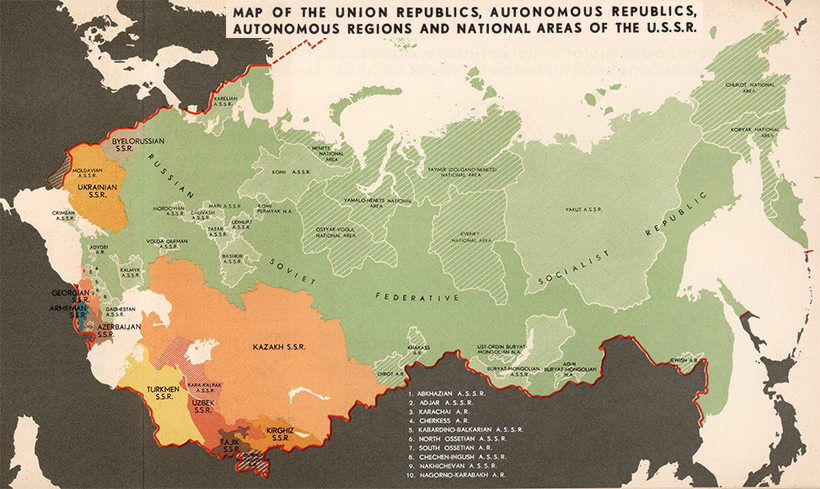
For more detail, view the full-sized version of this map
The USSR was set up as a federation of constituent union republics, which were either unitary states, such as Ukraine, or federations, such as Russia.
Below, we can see how this organizational structure was laid out.
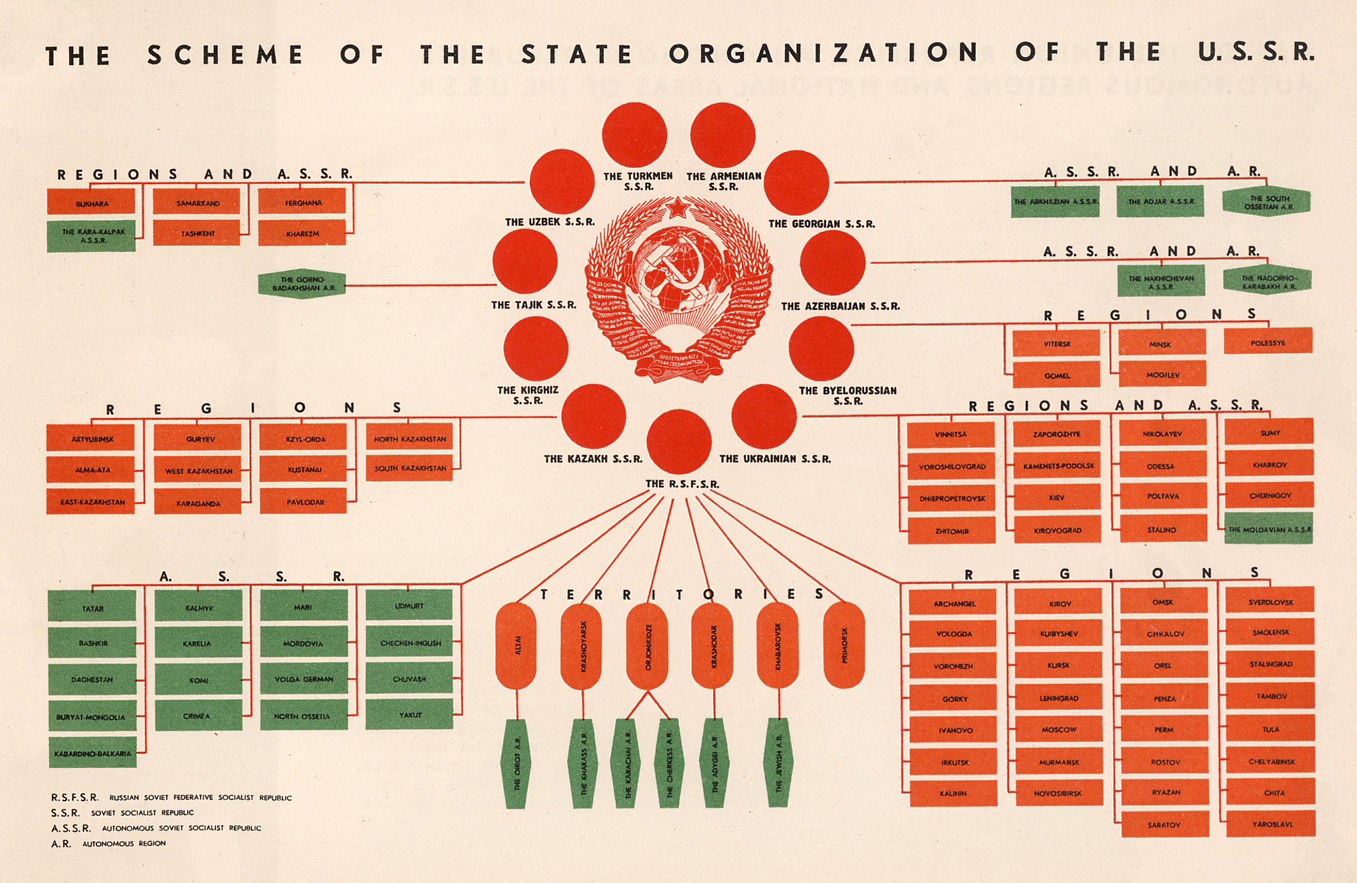
For more detail, view the full-sized version of this diagram
While nominally a union of equals, in practice the Soviet Union was dominated by the Russian Republic (RSFSR). This massive republic contained most of the country’s economic and political power, as well as the largest population and landmass.
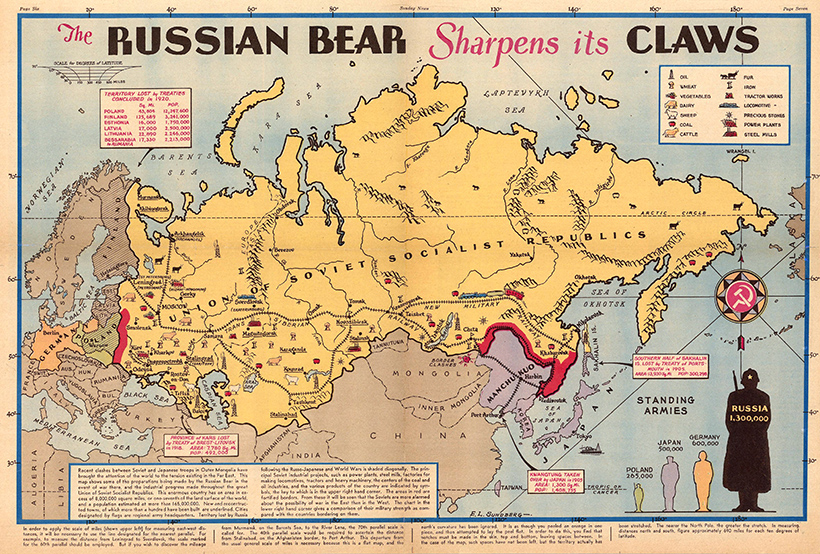
For more detail, view the full-sized version of this map
The geopolitical history of the USSR is inexorably bound with territorial disputes with neighboring regions. In the map above, from 1938, we can see that Soviet troops are clashing with Japan on the eastern edge of the country. On the other end, Stalin had annexed half of Poland, the three Baltic States, and portions of Romania, following the pact with Adolf Hitler.
This sequence of events set the stage for World War II.
The Soviet Empire
The USSR achieved victory in WWII, but at a great cost. An estimated 14% of the prewar population perished in the conflict.
By the end of the 1950s though, the Soviet Union was riding high on a string of impressive achievements on the world stage, from launching the first satellite into space to developing missiles that were a credible threat to American cities. As well, the country’s GDP growth was outpacing its Cold War rival.
This map is a snapshot of the USSR just prior to the construction of the Berlin Wall in 1962.
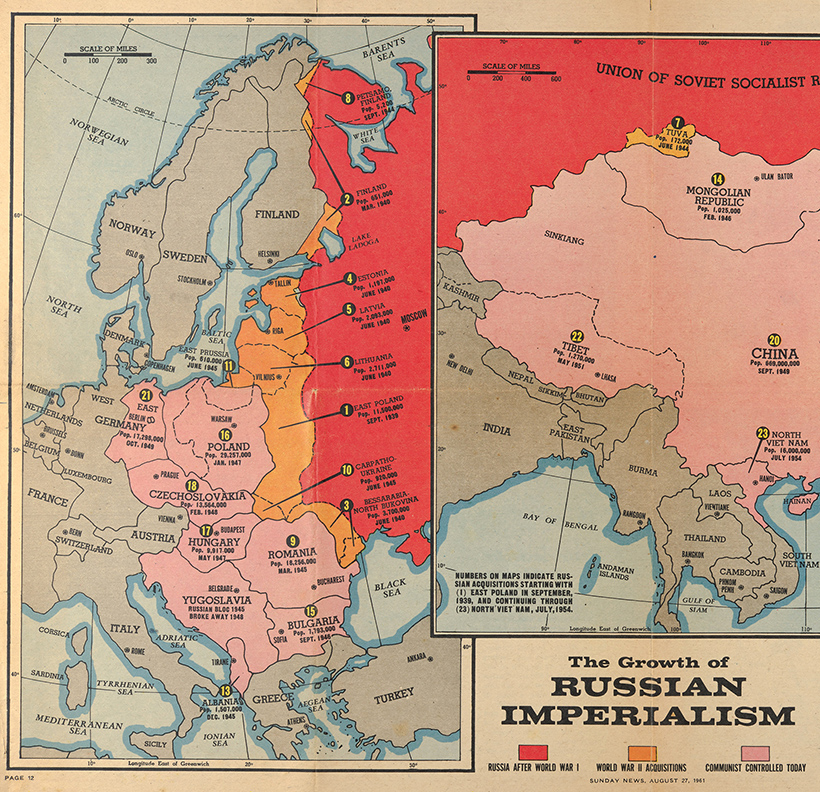
For more detail, view the full-sized version of this map
Above, in orange, we see how much territory the USSR ended up with after the war. This map is especially informative as it lists the populations of the territories at the time. Large portions of Eastern Europe—including more than 22 million people—were rolled behind the iron curtain.
The Waning Days of the USSR
After a prolonged period of stagnation, Mikhail Gorbachev attempted to reform the Soviet political and economic system with perestroika, which literally translates to “reconstruction”. This movement began a slow process of democratization that eventually destabilized Communist control through the late 1980s, hastening the collapse of the Soviet Union.
The map below is a snapshot of the USSR two years prior to its official dissolution in 1991.
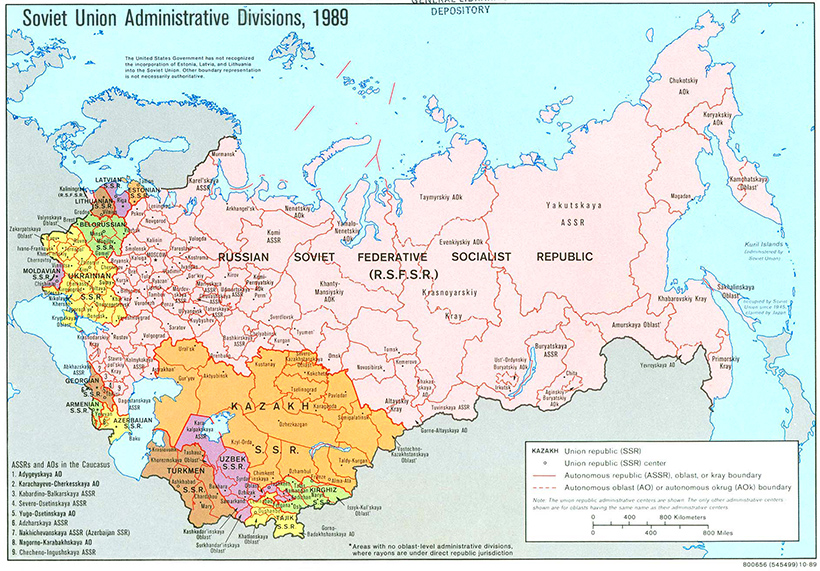
For more detail, view the full-sized version of this map
Many of the republics, shown in various colors above, were already seeing independence movements and unrest by this time, and would eventually declare independence one by one.
Here’s a list of the major regions that seceded from the USSR:
| USSR Subdivision | Present Day Country | Seceded from the USSR |
|---|---|---|
| Estonian SSR | 🇪🇪 Estonia | 8 May 1990 |
| Lithuanian SSR | 🇱🇹 Lithuania | 11 March 1990 |
| Latvian SSR | 🇱🇻 Latvia | 4 May 1990 |
| Azerbaijan SSR | 🇦🇿 Azerbaijan | 30 August 1991 |
| Georgian SSR | 🇬🇪 Georgia | 9 April 1991 |
| Russian SFSR | 🇷🇺 Russian Federation | 12 December 1991 |
| Uzbek SSR | 🇺🇿 Uzbekistan | 31 August 1991 |
| Moldavian SSR | 🇲🇩 Moldova | 27 August 1991 |
| Ukrainian SSR | 🇺🇦 Ukraine | 24 August 1991 |
| Byelorussian SSR | 🇧🇾 Belarus | 10 December 1991 |
| Turkmen SSR | 🇹🇲 Turkmenistan | 27 October 1991 |
| Armenian SSR | 🇦🇲 Armenia | 21 September 1991 |
| Tajik SSR | 🇹🇯 Tajikistan | 9 September 1991 |
| Kazakh SSR | 🇰🇿 Kazakhstan | 16 December 1991 |
| Kirghiz SSR | 🇰🇬 Kyrgyzstan | 31 August 1991 |
Since these regions seceded with their borders largely intact, a current map of this part of the world doesn’t look too different from the one above.
That said, even as borders remain static, the war in Ukraine demonstrates that power dynamics in this region are still very much in flux.


VC+
VC+: Get Our Key Takeaways From the IMF’s World Economic Outlook
A sneak preview of the exclusive VC+ Special Dispatch—your shortcut to understanding IMF’s World Economic Outlook report.

Have you read IMF’s latest World Economic Outlook yet? At a daunting 202 pages, we don’t blame you if it’s still on your to-do list.
But don’t worry, you don’t need to read the whole April release, because we’ve already done the hard work for you.
To save you time and effort, the Visual Capitalist team has compiled a visual analysis of everything you need to know from the report—and our VC+ Special Dispatch is available exclusively to VC+ members. All you need to do is log into the VC+ Archive.
If you’re not already subscribed to VC+, make sure you sign up now to access the full analysis of the IMF report, and more (we release similar deep dives every week).
For now, here’s what VC+ members get to see.
Your Shortcut to Understanding IMF’s World Economic Outlook
With long and short-term growth prospects declining for many countries around the world, this Special Dispatch offers a visual analysis of the key figures and takeaways from the IMF’s report including:
- The global decline in economic growth forecasts
- Real GDP growth and inflation forecasts for major nations in 2024
- When interest rate cuts will happen and interest rate forecasts
- How debt-to-GDP ratios have changed since 2000
- And much more!

Get the Full Breakdown in the Next VC+ Special Dispatch
VC+ members can access the full Special Dispatch by logging into the VC+ Archive, where you can also check out previous releases.
Make sure you join VC+ now to see exclusive charts and the full analysis of key takeaways from IMF’s World Economic Outlook.
Don’t miss out. Become a VC+ member today.
What You Get When You Become a VC+ Member
VC+ is Visual Capitalist’s premium subscription. As a member, you’ll get the following:
- Special Dispatches: Deep dive visual briefings on crucial reports and global trends
- Markets This Month: A snappy summary of the state of the markets and what to look out for
- The Trendline: Weekly curation of the best visualizations from across the globe
- Global Forecast Series: Our flagship annual report that covers everything you need to know related to the economy, markets, geopolitics, and the latest tech trends
- VC+ Archive: Hundreds of previously released VC+ briefings and reports that you’ve been missing out on, all in one dedicated hub
You can get all of the above, and more, by joining VC+ today.

-

 Education1 week ago
How Hard Is It to Get Into an Ivy League School?
-

 Technology2 weeks ago
Ranked: Semiconductor Companies by Industry Revenue Share
-

 Markets2 weeks ago
Ranked: The World’s Top Flight Routes, by Revenue
-

 Demographics2 weeks ago
Population Projections: The World’s 6 Largest Countries in 2075
-

 Markets2 weeks ago
The Top 10 States by Real GDP Growth in 2023
-

 Demographics2 weeks ago
The Smallest Gender Wage Gaps in OECD Countries
-

 Economy2 weeks ago
Where U.S. Inflation Hit the Hardest in March 2024
-

 Environment2 weeks ago
Top Countries By Forest Growth Since 2001