Automotive
Putting EV Valuations Into Perspective


Putting EV Valuations Into Perspective
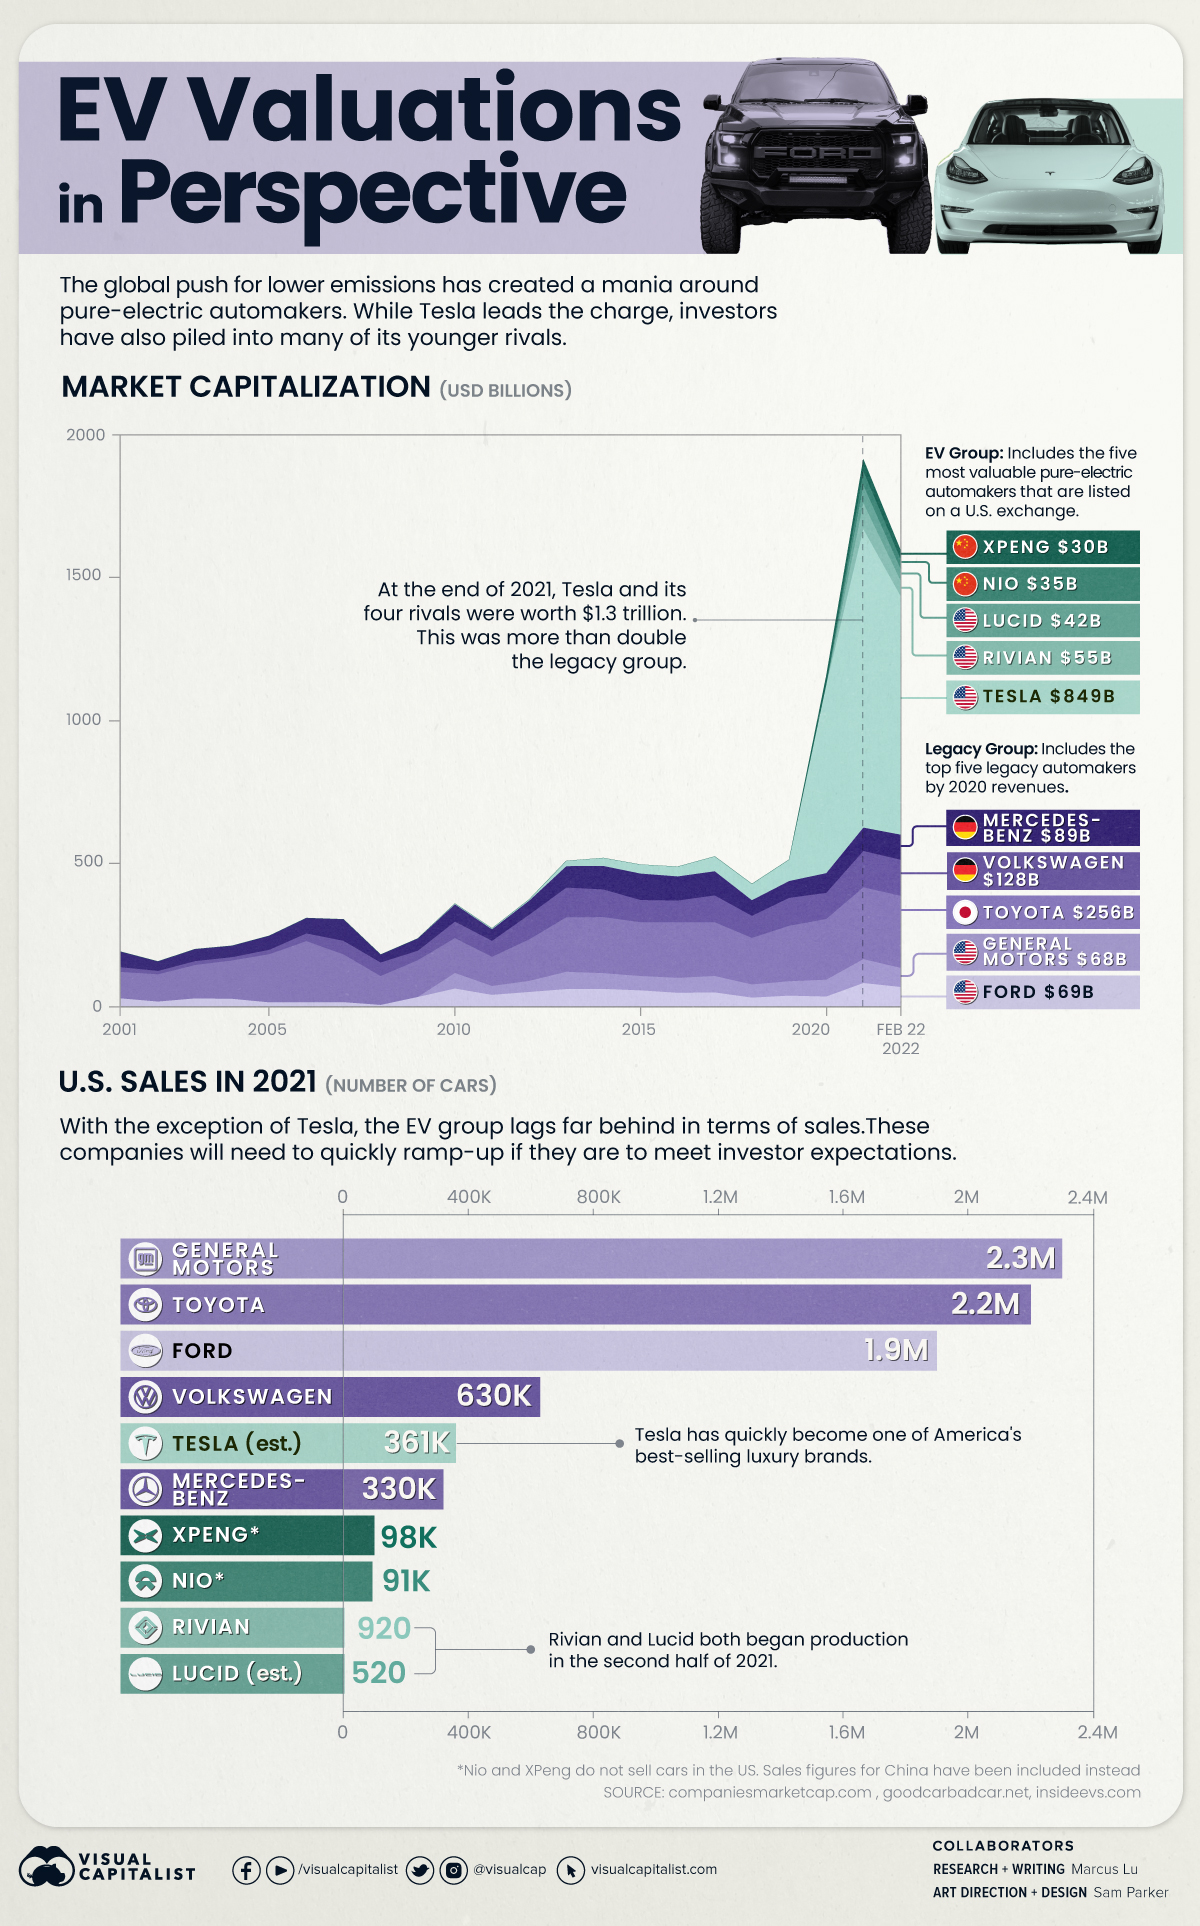
The global push for lower emissions has created a mania around pure-electric automakers. While Tesla leads the charge, institutional investors have also piled into many of its younger rivals.
For example, in 2019, Saudi Arabia’s sovereign wealth fund invested $1.3 billion into Lucid Motors. One year later, it was revealed that Amazon had a 20% stake (worth $3.8B) in Rivian.
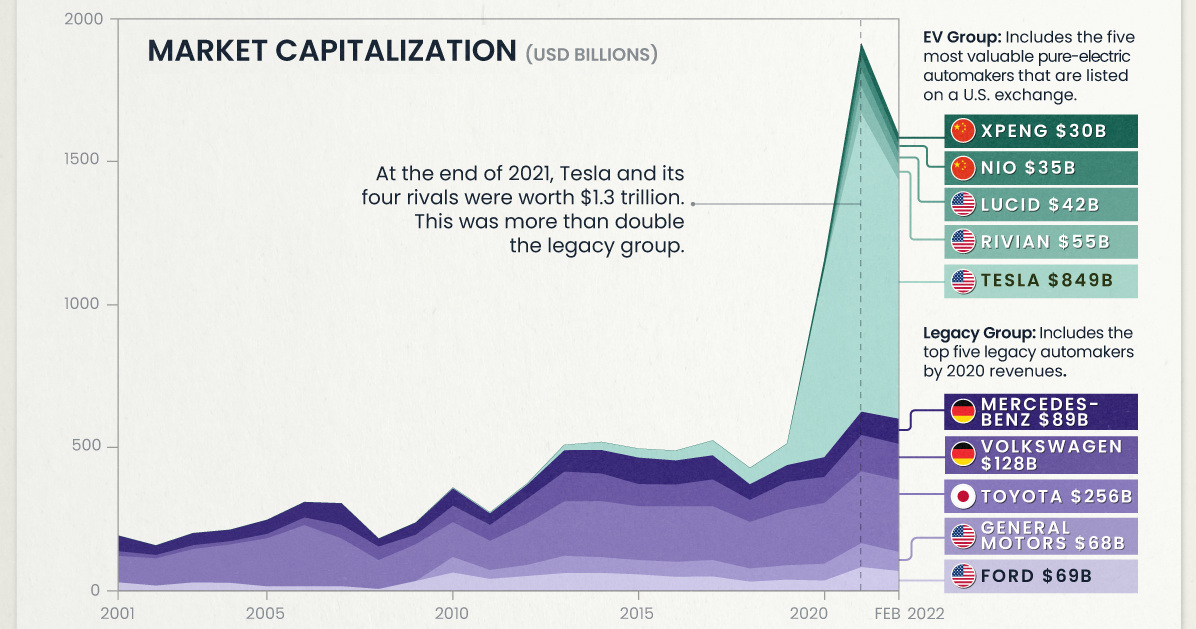
To see how quickly EV valuations have ballooned, we’ve visualized the historical market capitalizations (market caps) of 10 prominent automakers.
Legacy vs Pure-Electric
The legacy group includes five top traditional automakers, while the EV group includes the five most valuable pure-electric automakers that are listed on an American exchange.
The following table lists the market caps of these companies at various dates. While XPeng and NIO are listed on the New York Stock Exchange, they do not currently sell cars in the U.S.
| Automaker | Type | 2010 | 2015 | 2021 | 02/22/2022 |
|---|---|---|---|---|---|
| 🇺🇸 Tesla | EV | $3B | $31B | $1,061B | $849B |
| 🇯🇵 Toyota | Legacy | $124B | $191B | $255B | $256B |
| 🇩🇪 Volkswagen Group | Legacy | $59B | $79B | $129B | $128B |
| 🇩🇪 Mercedes-Benz | Legacy | $61B | $94B | $83B | $89B |
| 🇺🇸 Ford | Legacy | $63B | $57B | $83B | $69B |
| 🇺🇸 General Motors | Legacy | $55B | $51B | $85B | $68B |
| 🇺🇸 Rivian | EV | N/A | N/A | $93B | $55B |
| 🇺🇸 Lucid | EV | N/A | N/A | $63B | $42B |
| 🇨🇳 NIO | EV | N/A | N/A | $50B | $35B |
| 🇨🇳 Xpeng | EV | N/A | N/A | $41B | $30B |
Source: Companies Market Cap
At the end of 2021, Tesla and its four EV rivals were worth a combined $1.3 trillion. This was more than double of the legacy group, which was worth $635 billion. EV valuations have cooled since then, though Tesla is still the world’s most valuable automaker by a significant margin.
U.S. Sales in 2021
Comparing U.S. sales gives an interesting perspective on these companies’ relative scale. Once again, note that XPeng and NIO do not sell cars in America. We’ve provided figures for their home market (China) instead.
| Automaker | U.S. Sales in 2021 |
|---|---|
| General Motors | 2.3 million |
| Toyota | 2.2 million |
| Ford | 1.9 million |
| Volkswagen Group | 630,000 |
| Tesla | 361,000 (est.) |
| Mercedes-Benz | 330,000 |
| XPeng | 98,000 (China) |
| NIO | 91,000 (China) |
| Rivian | 920 |
| Lucid | 520 (est.) |
Source: Good Car Bad Car
Impressively, Tesla has overtaken Mercedes in the U.S. to become one of the country’s top luxury brands.
The Long Road Ahead
To satisfy investor expectations, Rivian and Lucid will need to rapidly scale their production and sales. Failing to do so could lead to significant stock price volatility.
Investors should also note that both companies could experience similar challenges as Tesla, which Musk has referred to as “production hell”. Rivian has already pushed back deliveries of its first SUV, while Lucid customers have been notified of delays due to “fit and finish” issues.
Nevertheless, these young manufacturers are setting some serious goals. Rivian aims to produce one million cars annually by the year 2030, while Lucid is targeting a more conservative 49,000 cars in 2023.
Tesla Goes on the Defensive
Tesla is still the undisputed EV leader, but competition is rapidly heating up.
On one hand, legacy automakers have been investing heavily in EV development, and new models are coming en masse. The Volkswagen Group is the biggest threat, selling 453,000 EVs globally in 2021 (up 96% over 2020). For reference, Tesla reported global sales of 936,000 in 2021.
On the other hand, Tesla must also defend its market share from an onslaught of Chinese entrants. This includes XPeng and NIO, which appear to be on similar trajectories. Both firms were founded in 2014, both sold nearly 100,000 EVs in 2021, and both have recently expanded into European markets. A U.S. expansion also seems to be imminent.
With the entire auto industry moving towards battery powered vehicles, will the market rethink its valuation of Tesla?


Lithium
Ranked: The Top 10 EV Battery Manufacturers in 2023
Asia dominates this ranking of the world’s largest EV battery manufacturers in 2023.


The Top 10 EV Battery Manufacturers in 2023
This was originally posted on our Voronoi app. Download the app for free on iOS or Android and discover incredible data-driven charts from a variety of trusted sources.
Despite efforts from the U.S. and EU to secure local domestic supply, all major EV battery manufacturers remain based in Asia.
In this graphic we rank the top 10 EV battery manufacturers by total battery deployment (measured in megawatt-hours) in 2023. The data is from EV Volumes.
Chinese Dominance
Contemporary Amperex Technology Co. Limited (CATL) has swiftly risen in less than a decade to claim the title of the largest global battery group.
The Chinese company now has a 34% share of the market and supplies batteries to a range of made-in-China vehicles, including the Tesla Model Y, SAIC’s MG4/Mulan, and various Li Auto models.
| Company | Country | 2023 Production (megawatt-hour) | Share of Total Production |
|---|---|---|---|
| CATL | 🇨🇳 China | 242,700 | 34% |
| BYD | 🇨🇳 China | 115,917 | 16% |
| LG Energy Solution | 🇰🇷 Korea | 108,487 | 15% |
| Panasonic | 🇯🇵 Japan | 56,560 | 8% |
| SK On | 🇰🇷 Korea | 40,711 | 6% |
| Samsung SDI | 🇰🇷 Korea | 35,703 | 5% |
| CALB | 🇨🇳 China | 23,493 | 3% |
| Farasis Energy | 🇨🇳 China | 16,527 | 2% |
| Envision AESC | 🇨🇳 China | 8,342 | 1% |
| Sunwoda | 🇨🇳 China | 6,979 | 1% |
| Other | - | 56,040 | 8% |
In 2023, BYD surpassed LG Energy Solution to claim second place. This was driven by demand from its own models and growth in third-party deals, including providing batteries for the made-in-Germany Tesla Model Y, Toyota bZ3, Changan UNI-V, Venucia V-Online, as well as several Haval and FAW models.
The top three battery makers (CATL, BYD, LG) collectively account for two-thirds (66%) of total battery deployment.
Once a leader in the EV battery business, Panasonic now holds the fourth position with an 8% market share, down from 9% last year. With its main client, Tesla, now sourcing batteries from multiple suppliers, the Japanese battery maker seems to be losing its competitive edge in the industry.
Overall, the global EV battery market size is projected to grow from $49 billion in 2022 to $98 billion by 2029, according to Fortune Business Insights.

-

 Lithium6 days ago
Ranked: The Top 10 EV Battery Manufacturers in 2023
-

 Green2 weeks ago
Top Countries By Forest Growth Since 2001
-

 United States2 weeks ago
Ranked: The Largest U.S. Corporations by Number of Employees
-

 Maps2 weeks ago
The Largest Earthquakes in the New York Area (1970-2024)
-

 Green2 weeks ago
Ranked: The Countries With the Most Air Pollution in 2023
-

 Green2 weeks ago
Ranking the Top 15 Countries by Carbon Tax Revenue
-

 Markets2 weeks ago
U.S. Debt Interest Payments Reach $1 Trillion
-

 Mining2 weeks ago
Gold vs. S&P 500: Which Has Grown More Over Five Years?