Technology
Visualizing the Power of the World’s Supercomputers


Visualizing the Power of the World’s Supercomputers
A supercomputer is a machine that is built to handle billions, if not trillions of calculations at once. Each supercomputer is actually made up of many individual computers (known as nodes) that work together in parallel.
A common metric for measuring the performance of these machines is flops, or floating point operations per second.
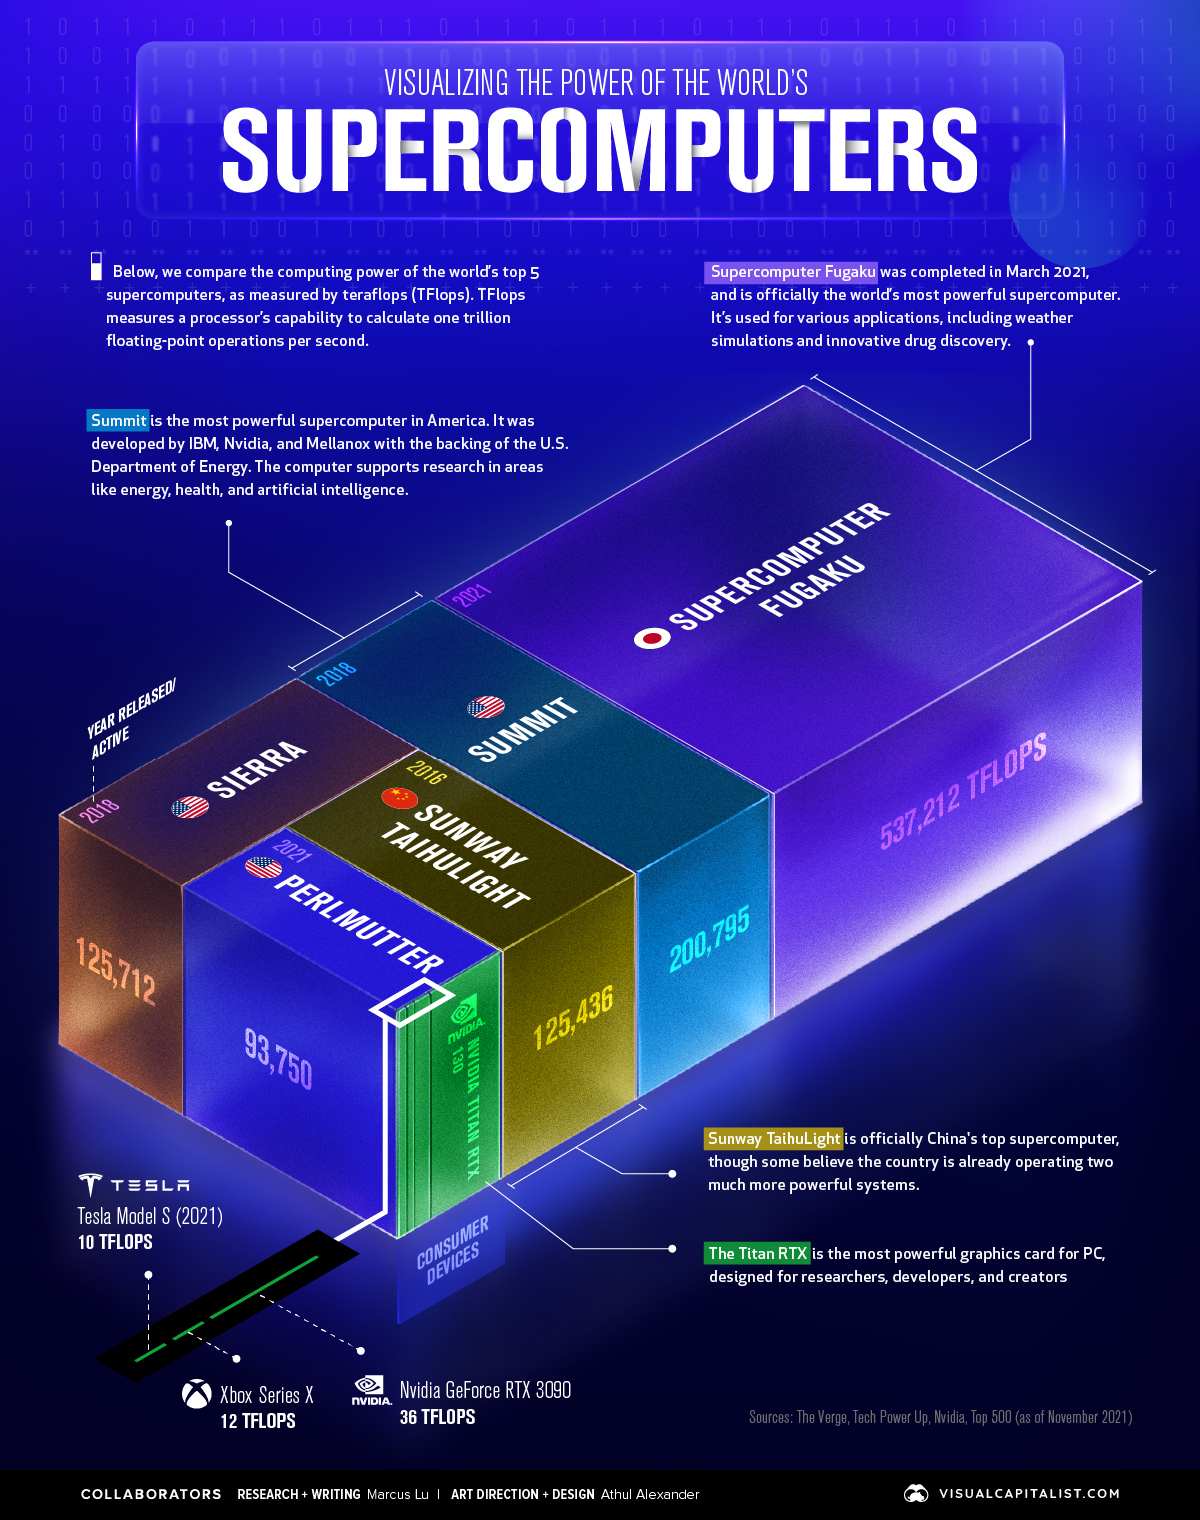
In this visualization, we’ve used November 2021 data from TOP500 to visualize the computing power of the world’s top five supercomputers. For added context, a number of modern consumer devices were included in the comparison.
Ranking by Teraflops
Because supercomputers can achieve over one quadrillion flops, and consumer devices are much less powerful, we’ve used teraflops as our comparison metric.
1 teraflop = 1,000,000,000,000 (1 trillion) flops.
| Rank | Name | Type | Teraflops |
|---|---|---|---|
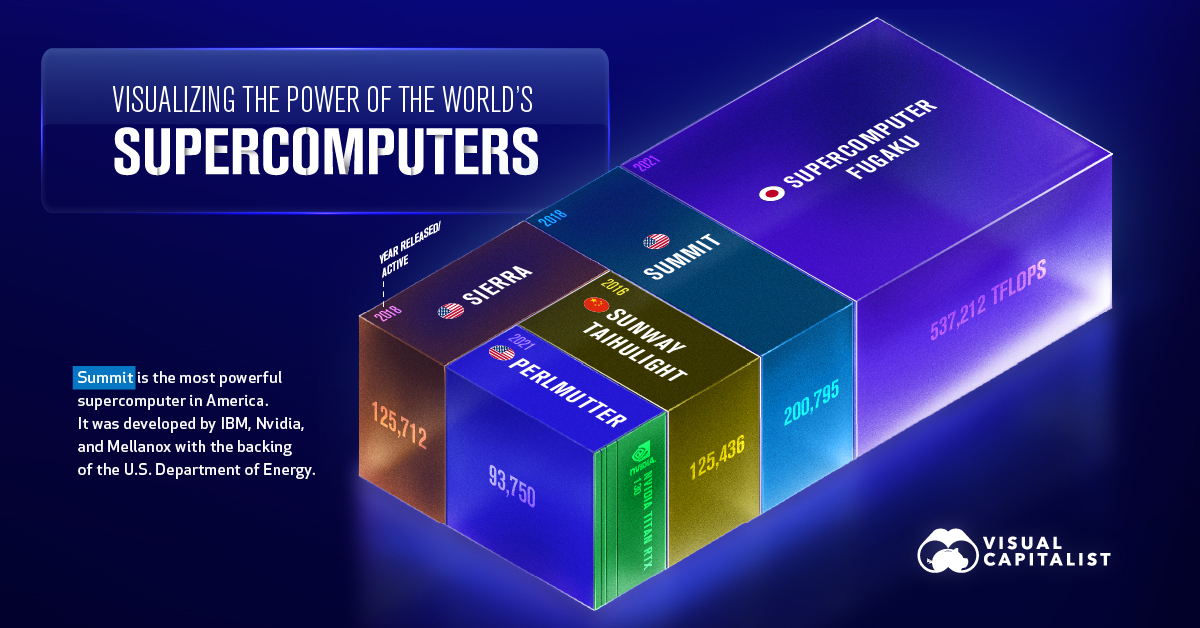
| #1 | 🇯🇵 Supercomputer Fugaku | Supercomputer | 537,212 |
| #2 | 🇺🇸 Summit | Supercomputer | 200,795 |
| #3 | 🇺🇸 Sierra | Supercomputer | 125,712 |
| #4 | 🇨🇳 Sunway Taihulight | Supercomputer | 125,436 |
| #5 | 🇺🇸 Perlmutter | Supercomputer | 93,750 |
| n/a | Nvidia Titan RTX | Consumer device | 130 |
| n/a | Nvidia GeForce RTX 3090 | Consumer device | 36 |
| n/a | Xbox Series X | Consumer device | 12 |
| n/a | Tesla Model S (2021) | Consumer device | 10 |
Supercomputer Fugaku was completed in March 2021, and is officially the world’s most powerful supercomputer. It’s used for various applications, including weather simulations and innovative drug discovery.
Sunway Taihulight is officially China’s top supercomputer and fourth most powerful in the world. That said, some experts believe that the country is already operating two much more powerful systems, based on data from anonymous sources.
As you can see, the most advanced consumer devices do not come close to supercomputing power. For example, it would take the combined power of 4,000 Nvidia Titan RTX graphics cards (the most powerful consumer card available) to measure up to the Fugaku.
Upcoming Supercomputers
One of China’s unrevealed supercomputers is supposedly named Oceanlite, and is a successor to Sunway Taihulight. It’s believed to have reached 1.3 exaflops, or 1.3 quintillion flops. The following table makes it easier to follow all of these big numbers.
| Name | Notation | Exponent | Prefix |
|---|---|---|---|
| Quintillion | 1,000,000,000,000,000,000 | 10^18 | Exa |
| Quadrillion | 1,000,000,000,000,000 | 10^15 | Peta |
| Trillion | 1,000,000,000,000 | 10^12 | Tera |
| Billion | 1,000,000,000 | 10^9 | Giga |
| Million | 1,000,000 | 10^6 | Mega |
In the U.S., rival chipmakers AMD and Intel have both won contracts from the U.S. Department of Energy to build exascale supercomputers. On the AMD side, there’s Frontier and El Capitan, while on the Intel side, there’s Aurora.
Also involved in the EL Capitan project is Hewlett Packard Enterprise (HPE), which claims the supercomputer will be able to reach 2 exaflops upon its completion in 2023. All of this power will be used to support several exciting endeavors:
- Enable advanced simulation and modeling to support the U.S. nuclear stockpile and ensure its reliability and security.
- Accelerate cancer drug discovery from six years to one year through a partnership with pharmaceutical company, GlaxoSmithKline
- Understand the dynamic and mutations of RAS proteins that are linked to 30% of human cancers
Altogether, exascale computing represents the ability to conduct complex analysis in a matter of seconds, rather than hours. This could unlock an even faster pace of innovation.


Technology
All of the Grants Given by the U.S. CHIPS Act
Intel, TSMC, and more have received billions in subsidies from the U.S. CHIPS Act in 2024.


All of the Grants Given by the U.S. CHIPS Act
This was originally posted on our Voronoi app. Download the app for free on iOS or Android and discover incredible data-driven charts from a variety of trusted sources.
This visualization shows which companies are receiving grants from the U.S. CHIPS Act, as of April 25, 2024. The CHIPS Act is a federal statute signed into law by President Joe Biden that authorizes $280 billion in new funding to boost domestic research and manufacturing of semiconductors.
The grant amounts visualized in this graphic are intended to accelerate the production of semiconductor fabrication plants (fabs) across the United States.
Data and Company Highlights
The figures we used to create this graphic were collected from a variety of public news sources. The Semiconductor Industry Association (SIA) also maintains a tracker for CHIPS Act recipients, though at the time of writing it does not have the latest details for Micron.
| Company | Federal Grant Amount | Anticipated Investment From Company |
|---|---|---|
| 🇺🇸 Intel | $8,500,000,000 | $100,000,000,000 |
| 🇹🇼 TSMC | $6,600,000,000 | $65,000,000,000 |
| 🇰🇷 Samsung | $6,400,000,000 | $45,000,000,000 |
| 🇺🇸 Micron | $6,100,000,000 | $50,000,000,000 |
| 🇺🇸 GlobalFoundries | $1,500,000,000 | $12,000,000,000 |
| 🇺🇸 Microchip | $162,000,000 | N/A |
| 🇬🇧 BAE Systems | $35,000,000 | N/A |
BAE Systems was not included in the graphic due to size limitations
Intel’s Massive Plans
Intel is receiving the largest share of the pie, with $8.5 billion in grants (plus an additional $11 billion in government loans). This grant accounts for 22% of the CHIPS Act’s total subsidies for chip production.
From Intel’s side, the company is expected to invest $100 billion to construct new fabs in Arizona and Ohio, while modernizing and/or expanding existing fabs in Oregon and New Mexico. Intel could also claim another $25 billion in credits through the U.S. Treasury Department’s Investment Tax Credit.
TSMC Expands its U.S. Presence
TSMC, the world’s largest semiconductor foundry company, is receiving a hefty $6.6 billion to construct a new chip plant with three fabs in Arizona. The Taiwanese chipmaker is expected to invest $65 billion into the project.
The plant’s first fab will be up and running in the first half of 2025, leveraging 4 nm (nanometer) technology. According to TrendForce, the other fabs will produce chips on more advanced 3 nm and 2 nm processes.
The Latest Grant Goes to Micron
Micron, the only U.S.-based manufacturer of memory chips, is set to receive $6.1 billion in grants to support its plans of investing $50 billion through 2030. This investment will be used to construct new fabs in Idaho and New York.

-

 Education1 week ago
How Hard Is It to Get Into an Ivy League School?
-

 Technology2 weeks ago
Ranked: Semiconductor Companies by Industry Revenue Share
-

 Markets2 weeks ago
Ranked: The World’s Top Flight Routes, by Revenue
-

 Demographics2 weeks ago
Population Projections: The World’s 6 Largest Countries in 2075
-

 Markets2 weeks ago
The Top 10 States by Real GDP Growth in 2023
-

 Demographics2 weeks ago
The Smallest Gender Wage Gaps in OECD Countries
-

 Economy2 weeks ago
Where U.S. Inflation Hit the Hardest in March 2024
-

 Environment2 weeks ago
Top Countries By Forest Growth Since 2001