Technology
Long Waves: The History of Innovation Cycles


Long Waves: How Innovation Cycles Influence Growth
Creative destruction plays a key role in entrepreneurship and economic development.
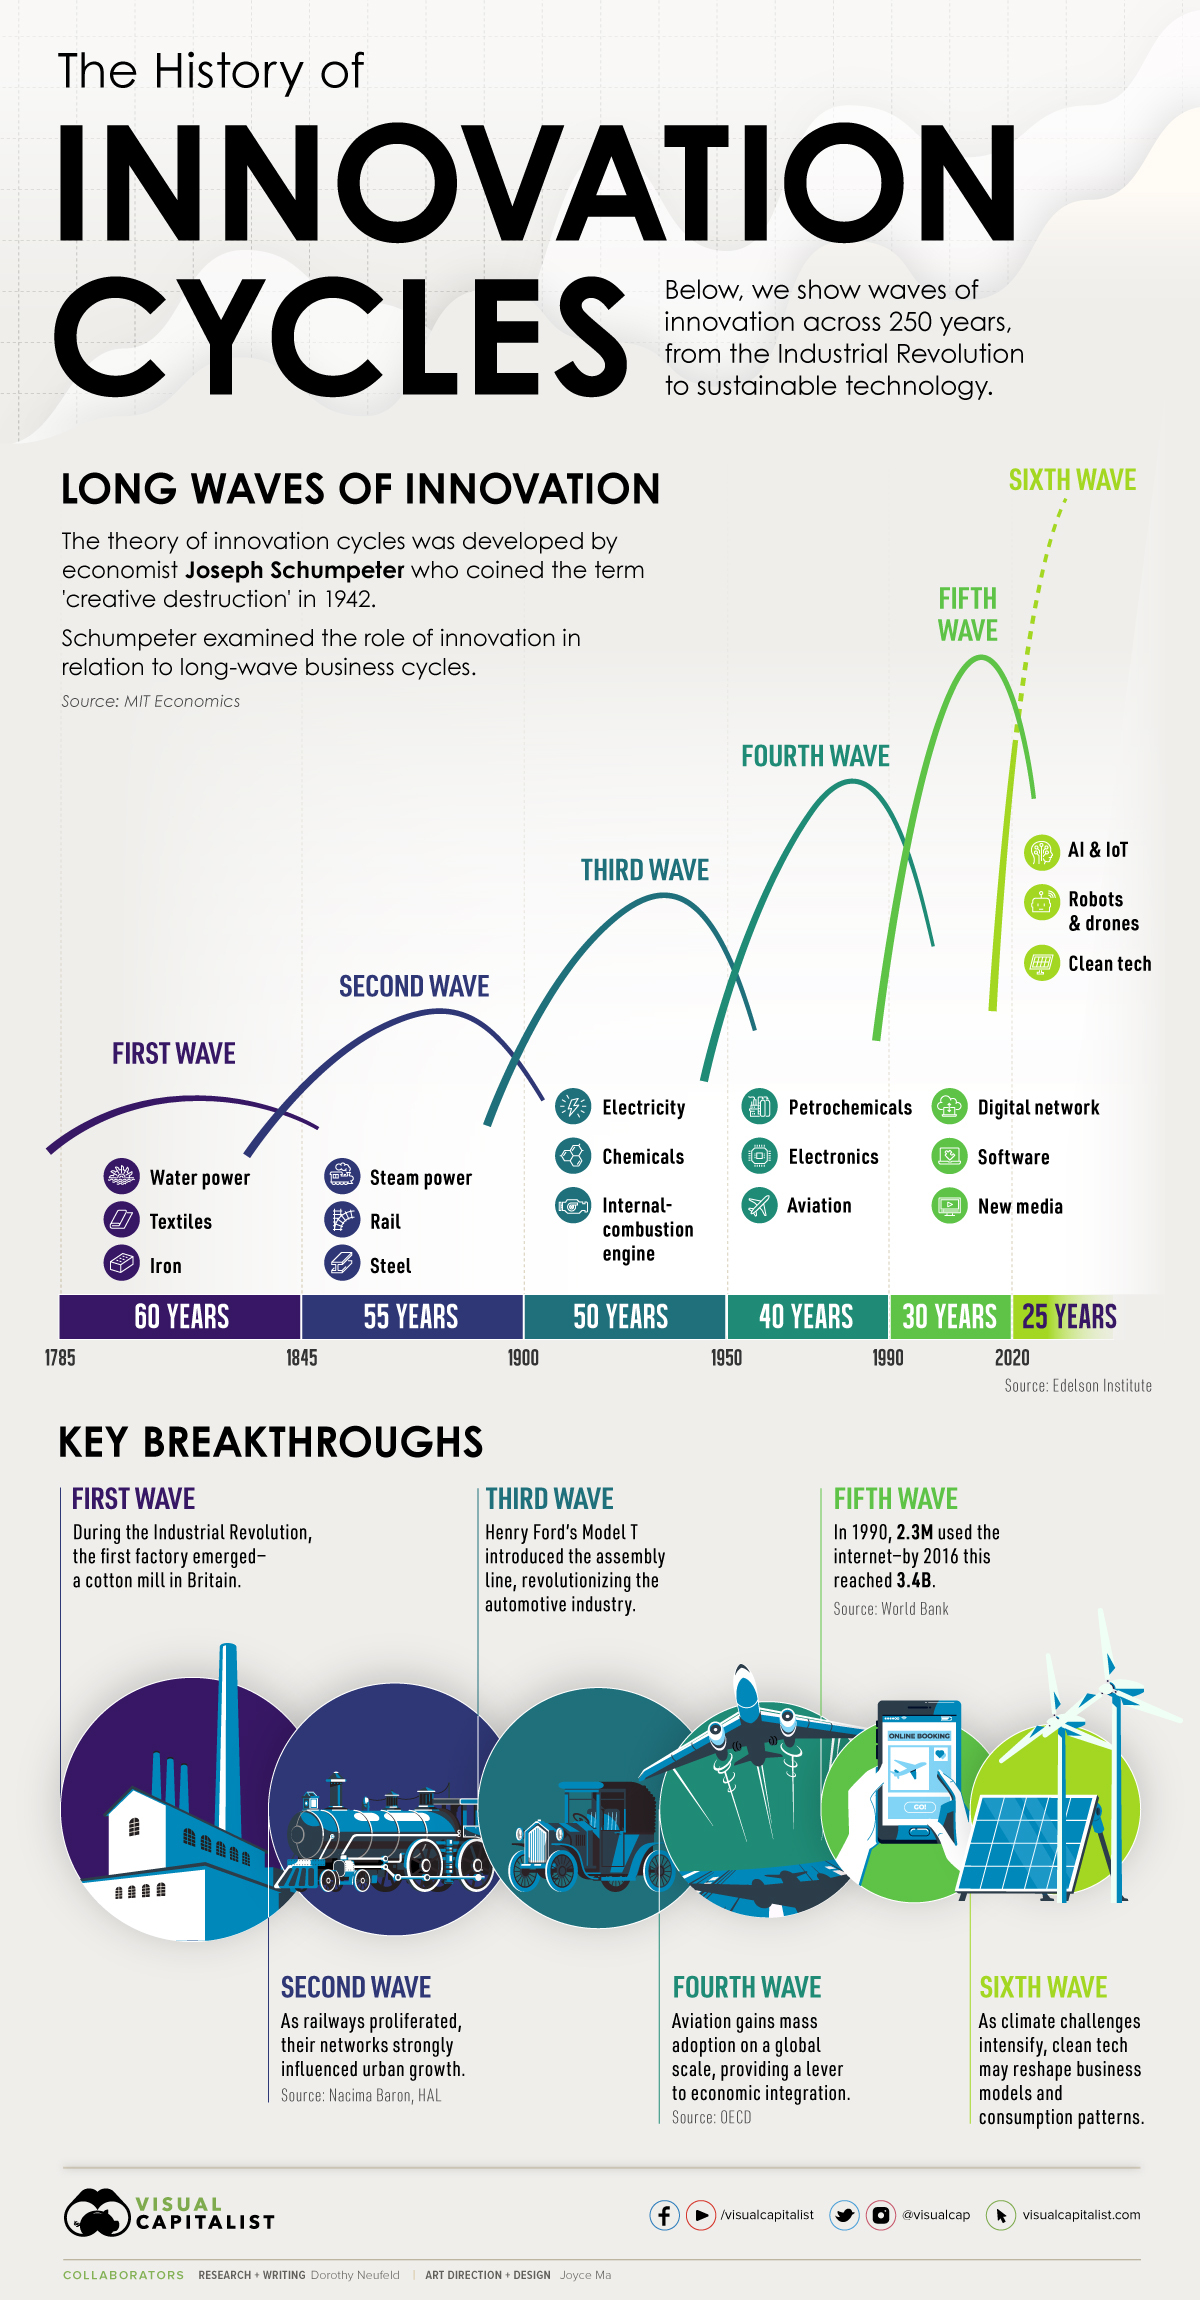
Coined by economist Joseph Schumpeter in 1942, the theory of “creative destruction” suggests that business cycles operate under long waves of innovation. Specifically, as markets are disrupted, key clusters of industries have outsized effects on the economy.
Take the railway industry, for example. At the turn of the 19th century, railways completely reshaped urban demographics and trade. Similarly, the internet disrupted entire industries—from media to retail.
The above infographic shows how innovation cycles have impacted economies since 1785, and what’s next for the future.
Innovation Cycles: The Six Waves
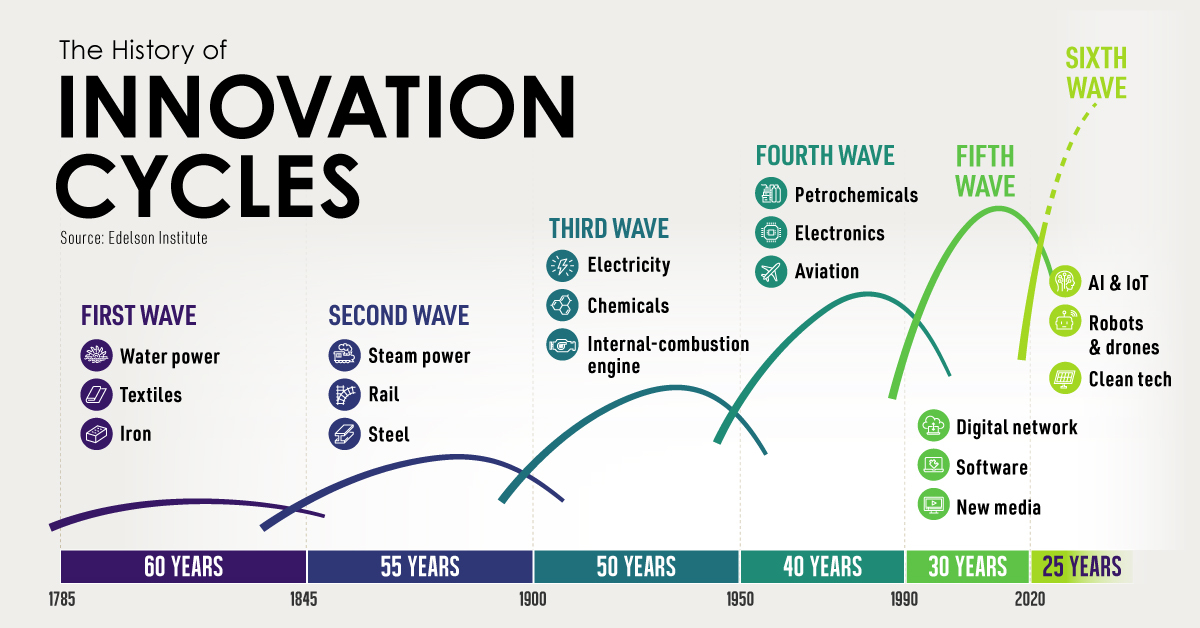
From the first wave of textiles and water power in the industrial revolution, to the internet in the 1990s, here are the six waves of innovation and their key breakthroughs.
| First Wave | Second Wave | Third Wave | Fourth Wave | Fifth Wave | Sixth Wave |
|---|---|---|---|---|---|
| Water Power Textiles Iron | Steam Rail Steel | Electricity Chemicals Internal-Combustion Engine | Petrochemicals Electronics Aviation | Digital Network Software New Media | Digitization (AI, IoT, AV, Robots & Drones) Clean Tech |
| 60 years | 55 years | 50 years | 40 years | 30 years | 25 years |
Source: Edelsen Institute, Detlef Reis
During the first wave of the Industrial Revolution, water power was instrumental in manufacturing paper, textiles, and iron goods. Unlike the mills of the past, full-sized dams fed turbines through complex belt systems. Advances in textiles brought the first factory, and cities expanded around them.
With the second wave, between about 1845 and 1900, came significant rail, steam, and steel advancements. The rail industry alone affected countless industries, from iron and oil to steel and copper. In turn, great railway monopolies were formed.
The emergence of electricity powering light and telephone communication through the third wave dominated the first half of the 1900s. Henry Ford introduced the Model T, and the assembly line transformed the auto industry. Automobiles became closely linked with the expansion of the American metropolis. Later, in the fourth wave, aviation revolutionized travel.
After the internet emerged by the early 1990s, barriers to information were upended. New media changed political discourse, news cycles, and communication in the fifth wave. The internet ushered in a new frontier of globalization, a borderless landscape of digital information flows.
Market Power
To the economist Schumpeter, technological innovations boosted economic growth and improved living standards.
However, these disruptors can also have a tendency to lead to monopolies. Especially during a cycle’s upswing, the strongest players realize wide margins, establish moats, and fend off rivals. Typically, these cycles begin when the innovations become of general use.
Of course, this can be seen today—never has the world been so closely connected. Information is more centralized than it has ever been, with Big Tech dominating global search traffic, social networks, and advertising.
Like the Big Tech behemoths of today, the rail industry had the power to control prices and push out competitors during the 19th century. At the peak, listed shares of rail companies on the New York Stock Exchange made up 60% of total stock market capitalization.
Waves of Change
As cycle longevity continues to shorten, the fifth wave may have a few years left under its belt.
The sixth wave, marked by artificial intelligence and digitization across information of things (IoT), robotics, and drones, will likely paint an entirely new picture. Namely, the automation of systems, predictive analytics, and data processing could make an impact. In turn, physical goods and services will likely be digitized. The time to complete tasks could shift from hours to even seconds.
At the same time, clean tech could come to the forefront. At the heart of each technological innovation is solving complex problems, and climate concerns are becoming increasingly pressing. Lower costs in solar PV and wind are also predicating efficiency advantages.


Technology
All of the Grants Given by the U.S. CHIPS Act
Intel, TSMC, and more have received billions in subsidies from the U.S. CHIPS Act in 2024.


All of the Grants Given by the U.S. CHIPS Act
This was originally posted on our Voronoi app. Download the app for free on iOS or Android and discover incredible data-driven charts from a variety of trusted sources.
This visualization shows which companies are receiving grants from the U.S. CHIPS Act, as of April 25, 2024. The CHIPS Act is a federal statute signed into law by President Joe Biden that authorizes $280 billion in new funding to boost domestic research and manufacturing of semiconductors.
The grant amounts visualized in this graphic are intended to accelerate the production of semiconductor fabrication plants (fabs) across the United States.
Data and Company Highlights
The figures we used to create this graphic were collected from a variety of public news sources. The Semiconductor Industry Association (SIA) also maintains a tracker for CHIPS Act recipients, though at the time of writing it does not have the latest details for Micron.
| Company | Federal Grant Amount | Anticipated Investment From Company |
|---|---|---|
| 🇺🇸 Intel | $8,500,000,000 | $100,000,000,000 |
| 🇹🇼 TSMC | $6,600,000,000 | $65,000,000,000 |
| 🇰🇷 Samsung | $6,400,000,000 | $45,000,000,000 |
| 🇺🇸 Micron | $6,100,000,000 | $50,000,000,000 |
| 🇺🇸 GlobalFoundries | $1,500,000,000 | $12,000,000,000 |
| 🇺🇸 Microchip | $162,000,000 | N/A |
| 🇬🇧 BAE Systems | $35,000,000 | N/A |
BAE Systems was not included in the graphic due to size limitations
Intel’s Massive Plans
Intel is receiving the largest share of the pie, with $8.5 billion in grants (plus an additional $11 billion in government loans). This grant accounts for 22% of the CHIPS Act’s total subsidies for chip production.
From Intel’s side, the company is expected to invest $100 billion to construct new fabs in Arizona and Ohio, while modernizing and/or expanding existing fabs in Oregon and New Mexico. Intel could also claim another $25 billion in credits through the U.S. Treasury Department’s Investment Tax Credit.
TSMC Expands its U.S. Presence
TSMC, the world’s largest semiconductor foundry company, is receiving a hefty $6.6 billion to construct a new chip plant with three fabs in Arizona. The Taiwanese chipmaker is expected to invest $65 billion into the project.
The plant’s first fab will be up and running in the first half of 2025, leveraging 4 nm (nanometer) technology. According to TrendForce, the other fabs will produce chips on more advanced 3 nm and 2 nm processes.
The Latest Grant Goes to Micron
Micron, the only U.S.-based manufacturer of memory chips, is set to receive $6.1 billion in grants to support its plans of investing $50 billion through 2030. This investment will be used to construct new fabs in Idaho and New York.

-

 Education1 week ago
How Hard Is It to Get Into an Ivy League School?
-

 Technology2 weeks ago
Ranked: Semiconductor Companies by Industry Revenue Share
-

 Markets2 weeks ago
Ranked: The World’s Top Flight Routes, by Revenue
-

 Demographics2 weeks ago
Population Projections: The World’s 6 Largest Countries in 2075
-

 Markets2 weeks ago
The Top 10 States by Real GDP Growth in 2023
-

 Demographics2 weeks ago
The Smallest Gender Wage Gaps in OECD Countries
-

 Economy2 weeks ago
Where U.S. Inflation Hit the Hardest in March 2024
-

 Environment2 weeks ago
Top Countries By Forest Growth Since 2001