Markets
How the Top Cryptocurrencies Performed in 2021
The Returns of Top Cryptocurrencies in 2021
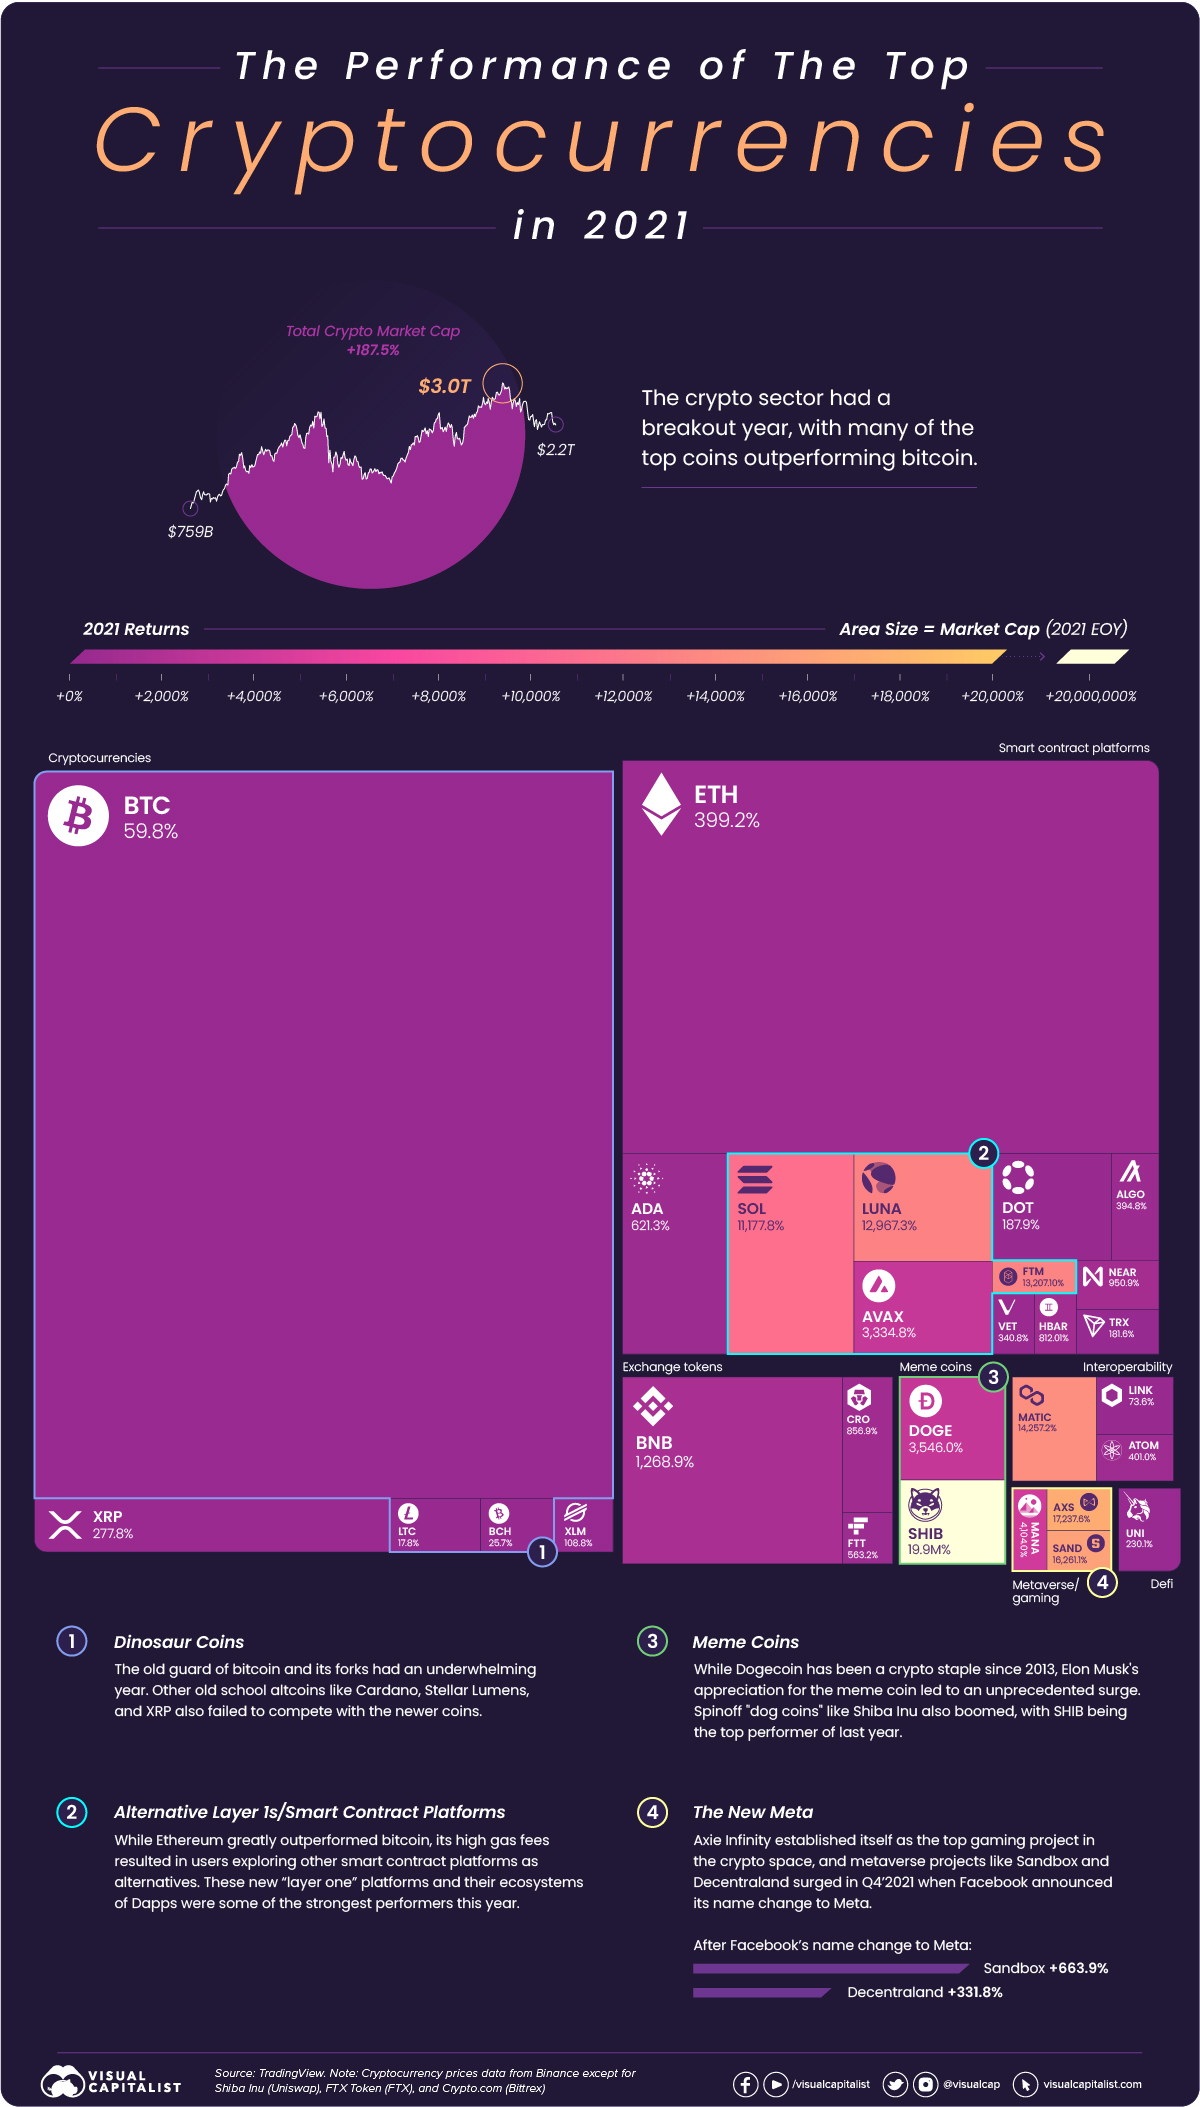
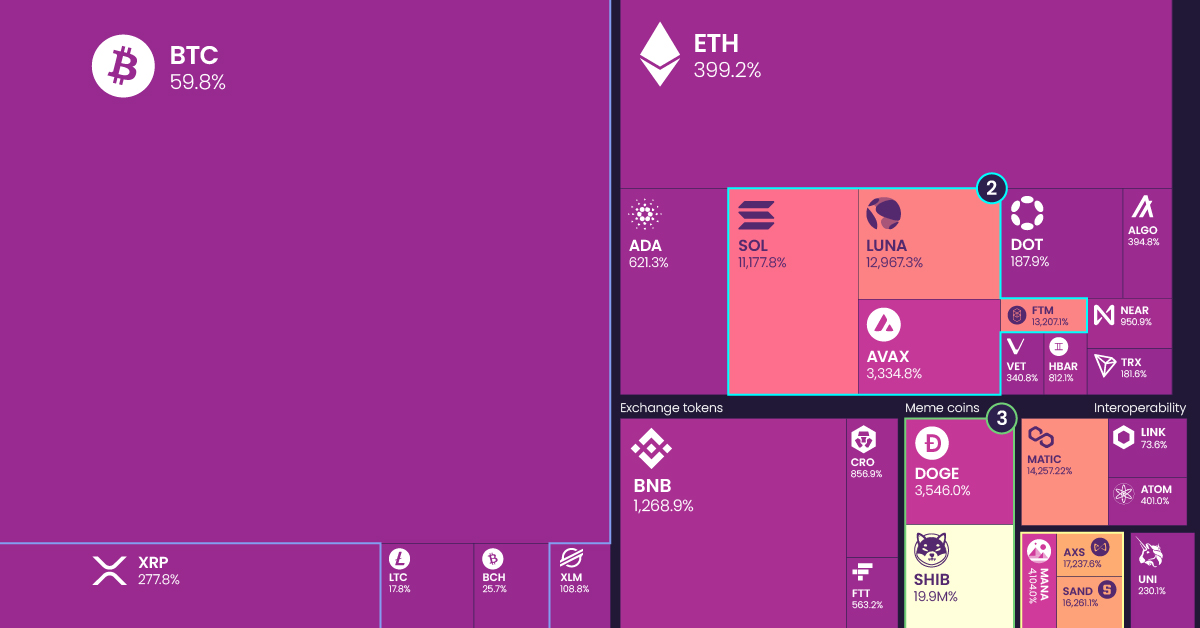
2021 saw the crypto markets boom and mature, with different sectors flourishing and largely outperforming the market leader, bitcoin.
While bitcoin only managed to return 59.8% last year, the crypto sector’s total market cap grew by 187.5%, with many of the top coins offering four and even five-digit percentage returns.
2021 Crypto Market Roundup
Last year wasn’t just a breakout year for crypto in terms of returns, but also the growing infrastructure’s maturity and resulting decorrelation of individual crypto industries and coins.
Crypto’s infrastructure has developed significantly, and there are now many more onramps for people to buy altcoins that don’t require purchasing and using bitcoin in the process. As a result, many cryptocurrency prices were more dictated by the value and functionality of their protocol and applications rather than their correlation to bitcoin.
| Cryptocurrency | Category | 2021 Returns |
|---|---|---|
| Bitcoin | Cryptocurrency | 59.8% |
| Ethereum | Smart Contract Platform | 399.2% |
| Binance Coin | Exchange Token | 1,268.9% |
| Solana | Smart Contract Platform | 11,177.8% |
| Cardano | Smart Contract Platform | 621.3% |
| XRP | Cryptocurrency | 277.8% |
| Terra | Smart Contract Platform | 12,967.3% |
| Avalanche | Smart Contract Platform | 3,334.8% |
| Polkadot | Smart Contract Platform | 187.9% |
| Dogecoin | Meme Coin | 3,546.0% |
Sources: TradingView, Binance, Uniswap, FTX, Bittrex
Bitcoin wasn’t the only cryptocurrency that didn’t manage to reach triple-digit returns in 2021. Litecoin and Bitcoin Cash also provided meagre double-digit percentage returns, as payment-focused cryptocurrencies were largely ignored for projects with smart contract capabilities.
Other older projects like Stellar Lumens (109%) and XRP (278%) provided triple-digit returns, with Cardano (621%) being the best performer of the old guard despite not managing to ship its smart contract functionality last year.
The Rise of the Ethereum Competitors
Ethereum greatly outpaced bitcoin in 2021, returning 399.2% as the popularity boom of NFTs and creation of DeFi 2.0 protocols like Olympus (OHM) expanded possible use-cases.
But with the rise of network activity, a 50% increase in transfers in 2021, Ethereum gas fees surged. From minimums of $20 for a single transaction, to NFT mint prices starting around $40 and going into the hundreds on congested network days, crypto’s retail crowd migrated to other smart contract platforms with lower fees.
Alternative budding smart contract platforms like Solana (11,178%), Avalanche (3,335%), and Fantom (13,207%) all had 4-5 digit percentage returns, as these protocols built out their own decentralized finance ecosystems and NFT markets.
With Ethereum set to merge onto the beacon chain this year, which uses proof of stake instead of proof of work, we’ll see if 2022 brings lower gas fees and retail’s return to Ethereum if the merge is successful.
Dog Coins Meme their Way to the Top
While many new cryptocurrencies with strong functionality and unique use-cases were rewarded with strong returns, it was memes that powered the greatest returns in cryptocurrencies this past year.
Dogecoin’s surge after Elon Musk’s “adoption” saw many other dog coins follow, with SHIB benefitting the most and returning an astounding 19.85 million percent.
But ever since Dogecoin’s run from $0.07 to a high of $0.74 in Q2 of last year, the original meme coin’s price has slowly bled -77% down to $0.17 at the time of writing. After the roller coaster ride of last year, 2022 started with a positive catalyst for Dogecoin holders as Elon Musk announced DOGE can be used to purchase Tesla merchandise.
Gamifying the Crypto Industry
The intersection between crypto, games, and the metaverse became more than just a pipe dream in 2021. Axie Infinity was the first crypto native game to successfully establish a play to earn structure that combines its native token (AXS) and in-game NFTs, becoming a sensation and source of income for many in the Philippines.
Other crypto gaming projects like Defi Kingdoms are putting recognizable game interfaces on decentralized finance applications, with the decentralized exchange becoming the town’s “marketplace” and yield farms being the “gardens” where yield is harvested. This fantasy aesthetic is more than just a new coat of paint, as the project with $1.04B of total value locked is developing an underlying play-to-earn game.
Along with gamification, 2021 saw crypto native and non-crypto developers put a big emphasis on the digital worlds or metaverses users will inhabit. Facebook’s name change to Meta resulted in the two prominent metaverse projects The Sandbox (SAND) and Decentraland (MANA) surge another few hundred percent to finish off the year at 16,261% and 4,104% returns respectively.
With so many eyes on the crypto sector after the 2021’s breakout year, we’ll see how developing U.S. regulation and changing macro conditions affect cryptocurrencies in 2022.


Markets
The European Stock Market: Attractive Valuations Offer Opportunities
On average, the European stock market has valuations that are nearly 50% lower than U.S. valuations. But how can you access the market?


European Stock Market: Attractive Valuations Offer Opportunities
Europe is known for some established brands, from L’Oréal to Louis Vuitton. However, the European stock market offers additional opportunities that may be lesser known.
The above infographic, sponsored by STOXX, outlines why investors may want to consider European stocks.
Attractive Valuations
Compared to most North American and Asian markets, European stocks offer lower or comparable valuations.
| Index | Price-to-Earnings Ratio | Price-to-Book Ratio |
|---|---|---|
| EURO STOXX 50 | 14.9 | 2.2 |
| STOXX Europe 600 | 14.4 | 2 |
| U.S. | 25.9 | 4.7 |
| Canada | 16.1 | 1.8 |
| Japan | 15.4 | 1.6 |
| Asia Pacific ex. China | 17.1 | 1.8 |
Data as of February 29, 2024. See graphic for full index names. Ratios based on trailing 12 month financials. The price to earnings ratio excludes companies with negative earnings.
On average, European valuations are nearly 50% lower than U.S. valuations, potentially offering an affordable entry point for investors.
Research also shows that lower price ratios have historically led to higher long-term returns.
Market Movements Not Closely Connected
Over the last decade, the European stock market had low-to-moderate correlation with North American and Asian equities.
The below chart shows correlations from February 2014 to February 2024. A value closer to zero indicates low correlation, while a value of one would indicate that two regions are moving in perfect unison.
| EURO STOXX 50 | STOXX EUROPE 600 | U.S. | Canada | Japan | Asia Pacific ex. China |
|
|---|---|---|---|---|---|---|
| EURO STOXX 50 | 1.00 | 0.97 | 0.55 | 0.67 | 0.24 | 0.43 |
| STOXX EUROPE 600 | 1.00 | 0.56 | 0.71 | 0.28 | 0.48 | |
| U.S. | 1.00 | 0.73 | 0.12 | 0.25 | ||
| Canada | 1.00 | 0.22 | 0.40 | |||
| Japan | 1.00 | 0.88 | ||||
| Asia Pacific ex. China | 1.00 |
Data is based on daily USD returns.
European equities had relatively independent market movements from North American and Asian markets. One contributing factor could be the differing sector weights in each market. For instance, technology makes up a quarter of the U.S. market, but health care and industrials dominate the broader European market.
Ultimately, European equities can enhance portfolio diversification and have the potential to mitigate risk for investors.
Tracking the Market
For investors interested in European equities, STOXX offers a variety of flagship indices:
| Index | Description | Market Cap |
|---|---|---|
| STOXX Europe 600 | Pan-regional, broad market | €10.5T |
| STOXX Developed Europe | Pan-regional, broad-market | €9.9T |
| STOXX Europe 600 ESG-X | Pan-regional, broad market, sustainability focus | €9.7T |
| STOXX Europe 50 | Pan-regional, blue-chip | €5.1T |
| EURO STOXX 50 | Eurozone, blue-chip | €3.5T |
Data is as of February 29, 2024. Market cap is free float, which represents the shares that are readily available for public trading on stock exchanges.
The EURO STOXX 50 tracks the Eurozone’s biggest and most traded companies. It also underlies one of the world’s largest ranges of ETFs and mutual funds. As of November 2023, there were €27.3 billion in ETFs and €23.5B in mutual fund assets under management tracking the index.
“For the past 25 years, the EURO STOXX 50 has served as an accurate, reliable and tradable representation of the Eurozone equity market.”
— Axel Lomholt, General Manager at STOXX
Partnering with STOXX to Track the European Stock Market
Are you interested in European equities? STOXX can be a valuable partner:
- Comprehensive, liquid and investable ecosystem
- European heritage, global reach
- Highly sophisticated customization capabilities
- Open architecture approach to using data
- Close partnerships with clients
- Part of ISS STOXX and Deutsche Börse Group
With a full suite of indices, STOXX can help you benchmark against the European stock market.
Learn how STOXX’s European indices offer liquid and effective market access.

-

 Economy2 days ago
Economic Growth Forecasts for G7 and BRICS Countries in 2024
The IMF has released its economic growth forecasts for 2024. How do the G7 and BRICS countries compare?
-

 Markets2 weeks ago
U.S. Debt Interest Payments Reach $1 Trillion
U.S. debt interest payments have surged past the $1 trillion dollar mark, amid high interest rates and an ever-expanding debt burden.
-

 United States2 weeks ago
Ranked: The Largest U.S. Corporations by Number of Employees
We visualized the top U.S. companies by employees, revealing the massive scale of retailers like Walmart, Target, and Home Depot.
-

 Markets2 weeks ago
The Top 10 States by Real GDP Growth in 2023
This graphic shows the states with the highest real GDP growth rate in 2023, largely propelled by the oil and gas boom.
-

 Markets2 weeks ago
Ranked: The World’s Top Flight Routes, by Revenue
In this graphic, we show the highest earning flight routes globally as air travel continued to rebound in 2023.
-

 Markets3 weeks ago
Ranked: The Most Valuable Housing Markets in America
The U.S. residential real estate market is worth a staggering $47.5 trillion. Here are the most valuable housing markets in the country.


-

 Debt1 week ago
How Debt-to-GDP Ratios Have Changed Since 2000
-
Markets2 weeks ago
Ranked: The World’s Top Flight Routes, by Revenue
-

 Countries2 weeks ago
Population Projections: The World’s 6 Largest Countries in 2075
-
Markets2 weeks ago
The Top 10 States by Real GDP Growth in 2023
-

 Demographics2 weeks ago
The Smallest Gender Wage Gaps in OECD Countries
-

 United States2 weeks ago
Where U.S. Inflation Hit the Hardest in March 2024
-

 Green2 weeks ago
Top Countries By Forest Growth Since 2001
-
United States2 weeks ago
Ranked: The Largest U.S. Corporations by Number of Employees