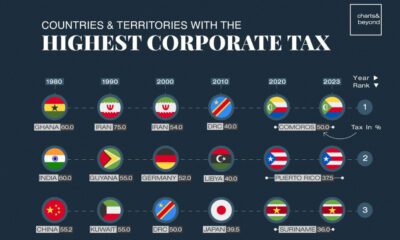
The world's top corporate tax rate stands at 50%, far higher than the global average. Here are the top 10...


click for more →


Scan with your phone's camera or QR code app to view
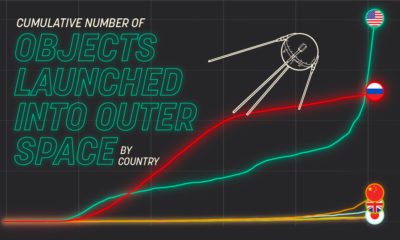

Which countries dominate outer space? This visual displays the number of objects every country has launched into space over time.


Media and information delivery is transforming at an increasing pace. Here's why the future will be more data-driven, transparent, and verifiable.
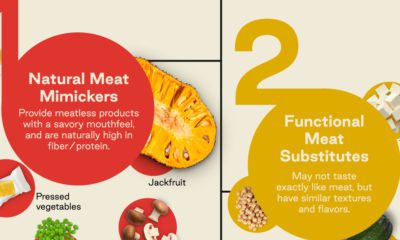

Explore the expanding and evolving universe of products that is helping boost the consumer potential of the plant-based alternatives market.
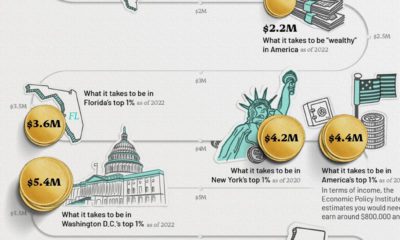

This infographic visualizes several net worth milestones to give you a better idea of where you stand today.


This era of data abundance should be propelling humankind forward, but valuable insights are often lost in the noise. Data storytelling holds the key.
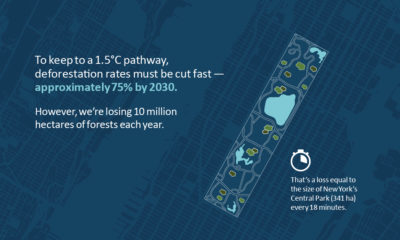

Tropical deforestation is a culprit of carbon emissions—which makes protecting forests crucial to keep to the Paris Agreement 1.5°C pathway.
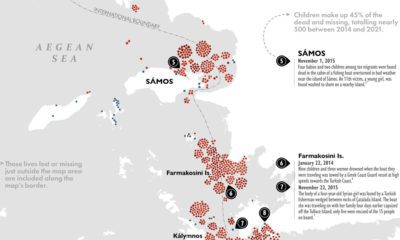

Each year, thousands of migrants take the journey along the Eastern Mediterranean to get to the EU. Some never make it to their destination.
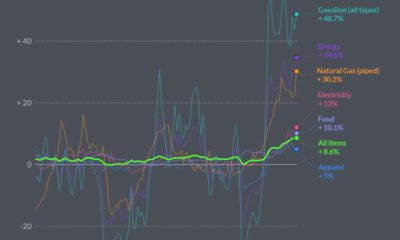

In May 2022, U.S. Inflation was the highest its been since 1981. Here’s a look at which products saw the biggest price jumps.
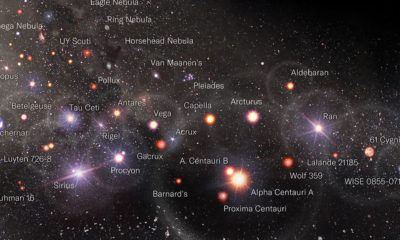

Scientists believe we've only discovered about 5% of the universe. Here's a map of what we've found so far, visualized using a log scale.
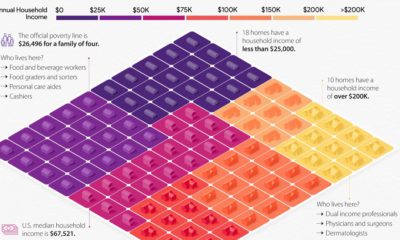

This visual breaks down U.S. household income categories as 100 homes, based on the most recent data from the U.S. Census Bureau.
This month, along with regularly scheduled features, Visual Capitalist founder Jeff Desjardins hosts a live Q&A session for VC+ subscribers.
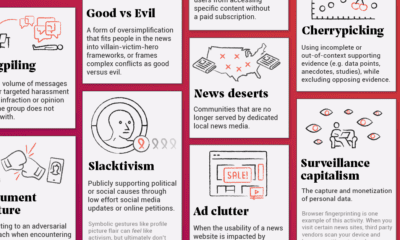

In this infographic, we catalog 33 problems with the social and mass media ecosystem.
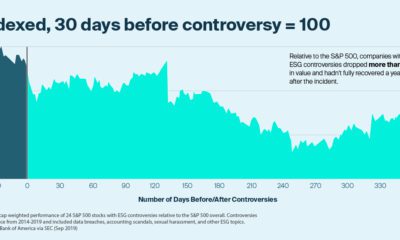

ESG controversies can damage a company's value, but ESG data may be able to help manage this risk. What are other reasons for using ESG data?
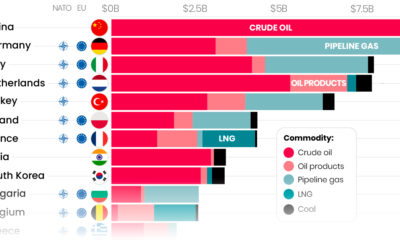

Here are the top importers of Russian fossil fuels since the start of the war.
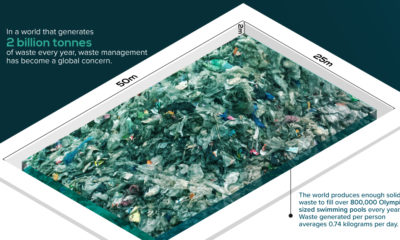

In a world that generates 2 billion tonnes of waste every year, landfill management has become a global concern.


Find out how to get access to a list of our greatest visualizations of all time. Opportunity ends July 1st, 2022.
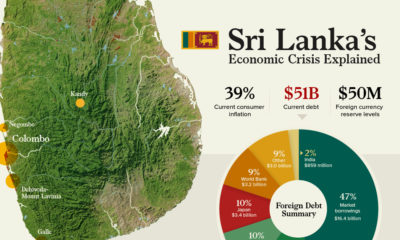

Sri Lanka is currently in an economic crisis with over $50 billion in debt and consumer inflation at 39%. So how did they get here?


 Creator Program
