Personal Finance
What Does It Take To Be Wealthy in America?
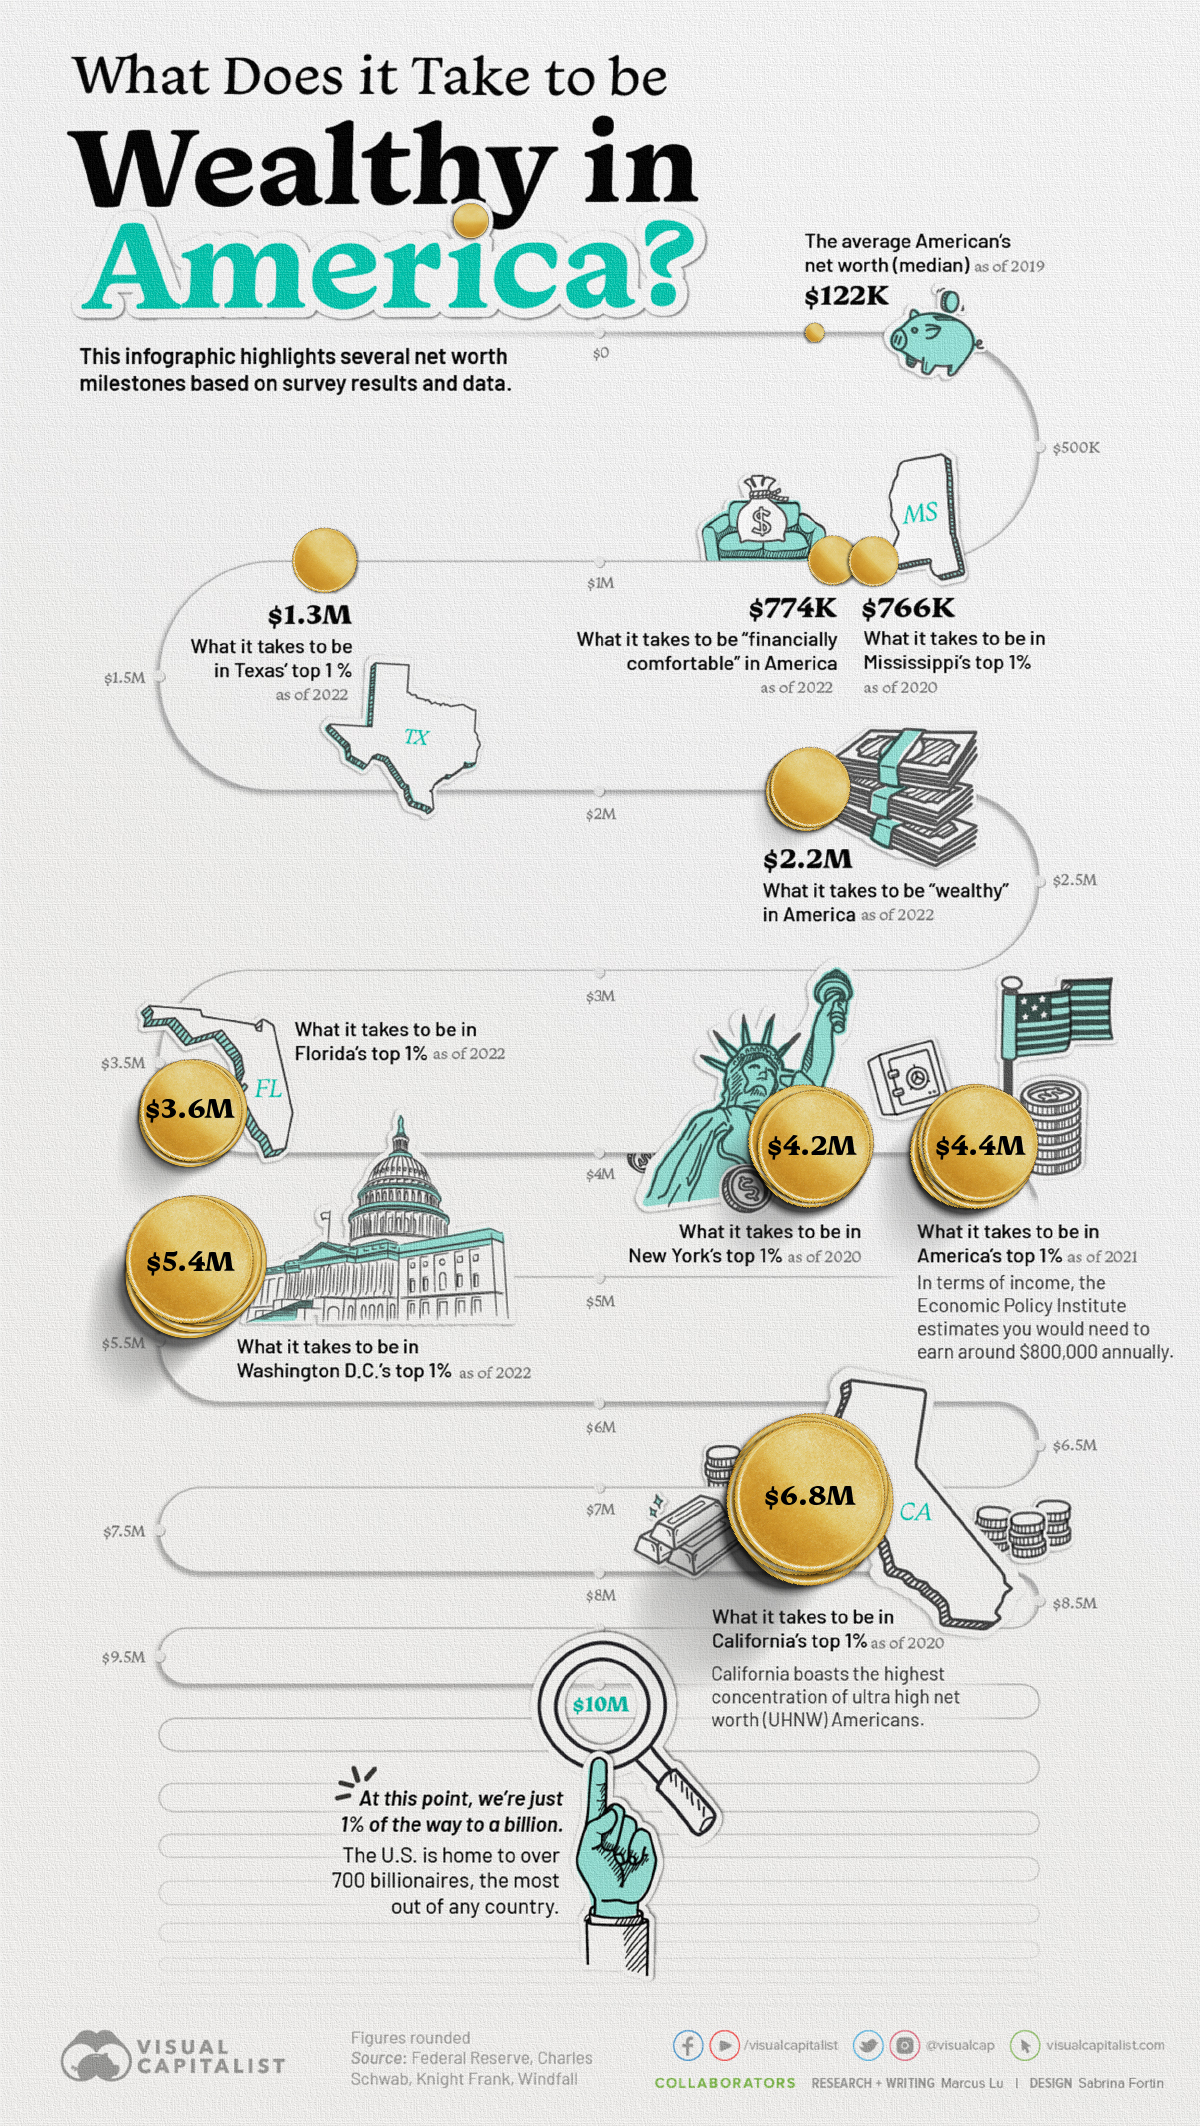


What Does it Take to be Wealthy in America?
The goalposts of wealth are always shifting due to inflation and other factors.
For example, someone with a net worth of $1 million several decades ago would have been considered very wealthy. According to recent survey results, however, $1 million is only enough to feel “financially comfortable” today.
In this infographic, we’ve visualized several money milestones to give you a better idea of what it really takes to be wealthy in America.
Net Worth Milestones
This table lists the data used in the above infographic.
It covers data on what it takes to get into the top one percent for wealth in key states, along with broader survey results about what net worth thresholds must be crossed in order to be considered “comfortable financially” or even “wealthy”.
| Milestone | Source | As of Date | Net Worth (USD) |
|---|---|---|---|
| What it takes to be in California’s top 1% | Windfall | 2020 | $6.8M |
| What it takes to be in America’s top 1% | Knight Frank | 2021 | $4.4M |
| What it takes to be in New York’s top 1% | Windfall | 2020 | $4.2M |
| What it takes to be wealthy in America | Charles Schwab survey | 2022 | $2.2M |
| What it takes to be in the UK’s top 1% | Knight Frank | 2021 | $1.8M |
| What it takes to be financially comfortable in America | Charles Schwab survey | 2022 | $774,000 |
| What it takes to be in Mississippi’s top 1% | Windfall | 2020 | $766,000 |
| The average American’s net worth (median) | Federal Reserve | 2019 | $122,000 |
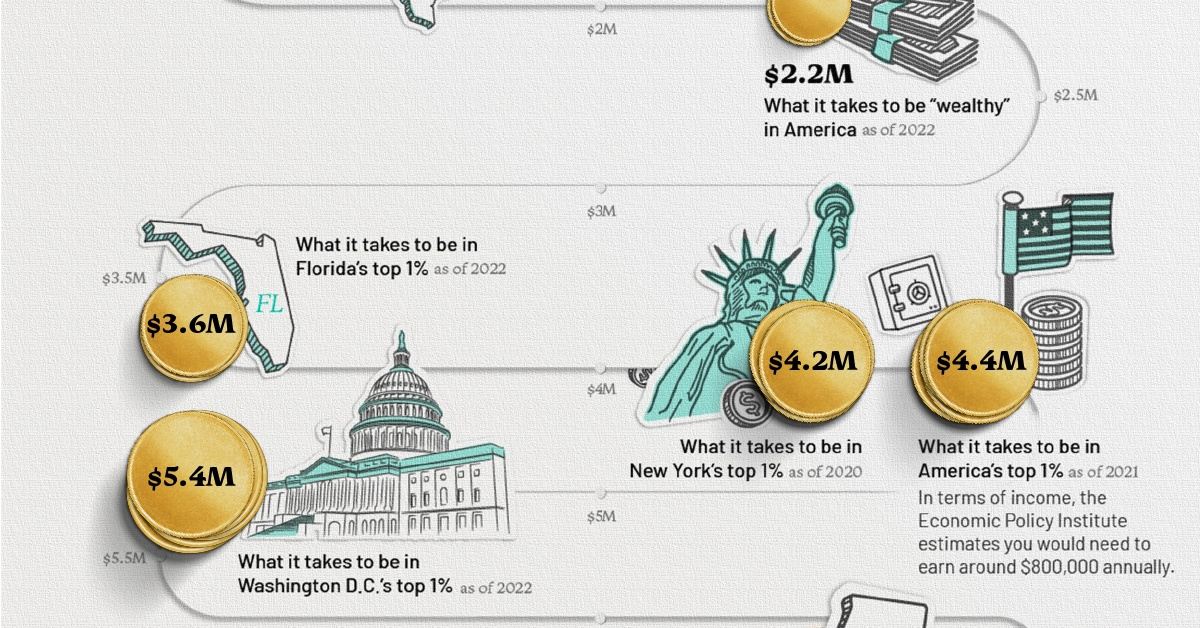
According to Charles Schwab’s Modern Wealth Survey, a net worth of $774,000 is needed to feel “financially comfortable”, while $2.2 million is needed to be considered “wealthy”.
Both of these milestones are far greater than the average (median) American’s wealth, which according to the Federal Reserve, was $122,000 in 2019.
Joining the One Percent
Research by Knight Frank determined that in order to be a member of America’s one percent, one would need a net worth of $4.4 million. This is very high compared to other developed countries such as Japan ($1.5 million), the UK ($1.8 million), and Australia ($2.8 million).
The difference is partly due to America’s large population of ultra high net worth individuals, which includes the country’s 724 billionaires. See below for a list of the top five countries by number of billionaires.
| Country | Number of Billionaires |
|---|---|
| 🇺🇸 U.S. | 724 |
| 🇨🇳 China (inc. Hong Kong & Macau) | 698 |
| 🇮🇳 India | 140 |
| 🇩🇪 Germany | 136 |
| 🇷🇺 Russia | 117 |
Source: World Population Review (As of 2021)
Focusing again on the U.S., we can also see large discrepancies at the individual state level. Entry into California’s one percent requires a net worth of $6.8 million, which is 62% higher than the national average.
California is famously home to many of the world’s richest people, including Google co-founder Larry Page, and Facebook founder Mark Zuckerberg.
Being a one percenter in Mississippi, on the other hand, requires $766,000. That’s 83% lower than the national average, and just a tad lower than the amount needed to be “financially comfortable” by the average American. This is partially due to Mississippi’s poverty rate of 19.6%, which according to the U.S. Census Bureau, is the highest in the country.


Personal Finance
Chart: The Declining Value of the U.S. Federal Minimum Wage
This graphic compares the nominal vs. inflation-adjusted value of the U.S. minimum wage, from 1940 to 2023.


The Declining Value of the U.S. Federal Minimum Wage
This was originally posted on our Voronoi app. Download the app for free on iOS or Android and discover incredible data-driven charts from a variety of trusted sources.
This graphic illustrates the history of the U.S. federal minimum wage using data compiled by Statista, in both nominal and real (inflation-adjusted) terms. The federal minimum wage was raised to $7.25 per hour in July 2009, where it has remained ever since.
Nominal vs. Real Value
The data we used to create this graphic can be found in the table below.
| Year | Nominal value ($/hour) | Real value ($/hour) |
|---|---|---|
| 1940 | 0.3 | 6.5 |
| 1945 | 0.4 | 6.82 |
| 1950 | 0.75 | 9.64 |
| 1955 | 0.75 | 8.52 |
| 1960 | 1 | 10.28 |
| 1965 | 1.25 | 12.08 |
| 1970 | 1.6 | 12.61 |
| 1975 | 2.1 | 12.04 |
| 1980 | 3.1 | 11.61 |
| 1985 | 3.35 | 9.51 |
| 1990 | 3.8 | 8.94 |
| 1995 | 4.25 | 8.49 |
| 2000 | 5.15 | 9.12 |
| 2005 | 5.15 | 8.03 |
| 2010 | 7.25 | 10.09 |
| 2015 | 7.25 | 9.3 |
| 2018 | 7.25 | 8.78 |
| 2019 | 7.25 | 8.61 |
| 2020 | 7.25 | 8.58 |
| 2021 | 7.25 | 8.24 |
| 2022 | 7.25 | 7.61 |
| 2023 | 7.25 | 7.25 |
What our graphic shows is how inflation has eroded the real value of the U.S. minimum wage over time, despite nominal increases.
For instance, consider the year 1960, when the federal minimum wage was $1 per hour. After accounting for inflation, this would be worth around $10.28 today!
The two lines converge at 2023 because the nominal and real value are identical in present day terms.
Many States Have Their Own Minimum Wage
According to the National Conference of State Legislatures (NCSL), 30 states and Washington, D.C. have implemented a minimum wage that is higher than $7.25.
The following states have adopted the federal minimum: Georgia, Idaho, Indiana, Iowa, Kansas, Kentucky, New Hampshire, North Carolina, North Dakota, Oklahoma, Pennsylvania, Texas, Utah, Wisconsin, and Wyoming.
Meanwhile, the states of Alabama, Louisiana, Mississippi, South Carolina, and Tennessee have no wage minimums, but have to follow the federal minimum.
How Does the U.S. Minimum Wage Rank Globally?
If you found this topic interesting, check out Mapped: Minimum Wage Around the World to see which countries have the highest minimum wage in monthly terms, as of January 2023.

-

 Sports1 week ago
The Highest Earning Athletes in Seven Professional Sports
-

 Countries2 weeks ago
Population Projections: The World’s 6 Largest Countries in 2075
-

 Markets2 weeks ago
The Top 10 States by Real GDP Growth in 2023
-

 Demographics2 weeks ago
The Smallest Gender Wage Gaps in OECD Countries
-

 United States2 weeks ago
Where U.S. Inflation Hit the Hardest in March 2024
-

 Green2 weeks ago
Top Countries By Forest Growth Since 2001
-

 United States2 weeks ago
Ranked: The Largest U.S. Corporations by Number of Employees
-

 Maps2 weeks ago
The Largest Earthquakes in the New York Area (1970-2024)